

The only indicator you will ever need
Simple solution to rule all markets. Made by professionals for every day use.

Designed for crypto, stocks and forex
For investors, swing traders and day traders
Trend following
Top and bottom warnings
Automatic alerts to any device
One simple robust solution
Don't miss out on biggest price moves ever again
Outperform HODLing many times
Trade with confidence
Simple solution to start right away
Checkout MACB Indicator tutorial video

If you need simple trading strategy this package is for you! Don't worry about price movements, just follow the strategy.
Great for people working 9-5 jobs who can't spend much time for analysing the charts
Strategy pack includes: MACB Trend Strategy, DC MACB Strategy, MACB Momentum Strategy
MACB Bottom Indicator included in Strategy pack!
Backtested for many crypto, stocks and forex
Strategy User Manual with instruction for backtesting any other asset not described by me - create your own profitable strategy!
Simple alerts to any device
Customizable to specific asset
Ready to use strategy backtested for many cryptos, stocks, forex with outstanding results

MACB Indicator to rule all markets
80$ Monthly
799$ One-time payment LIFETIME access

Simple, easy to follow strategies
60$ Monthly
399$ One-time payment LIFETIME access

MACB Indicator + Strategy bundle
99$ Monthly
999$ One-time payment LIFETIME access
Testimonials
"You can't imagine how easy my investing has become!"
"I am really glad I took next step and deceided to go for MACB Indicator. It paid for inself within hours after purchase!"
"This stuff gives you the best bang for the buck! My confidence is up and I am excited about my trades, not scared like I used to be."
"If you are still wondering - just stop. You don't need anything else to be profitable trader. Stop loosing your time and money - get the tool which does the job."
"I was sceptical about that indicator, taking into account that it is way cheaper than other indicators out there.I was really surprised about how EFFECTIVE it was, straight of the "shelf". It takes just couple of minutes to get it running. And it runs like a charm :)"
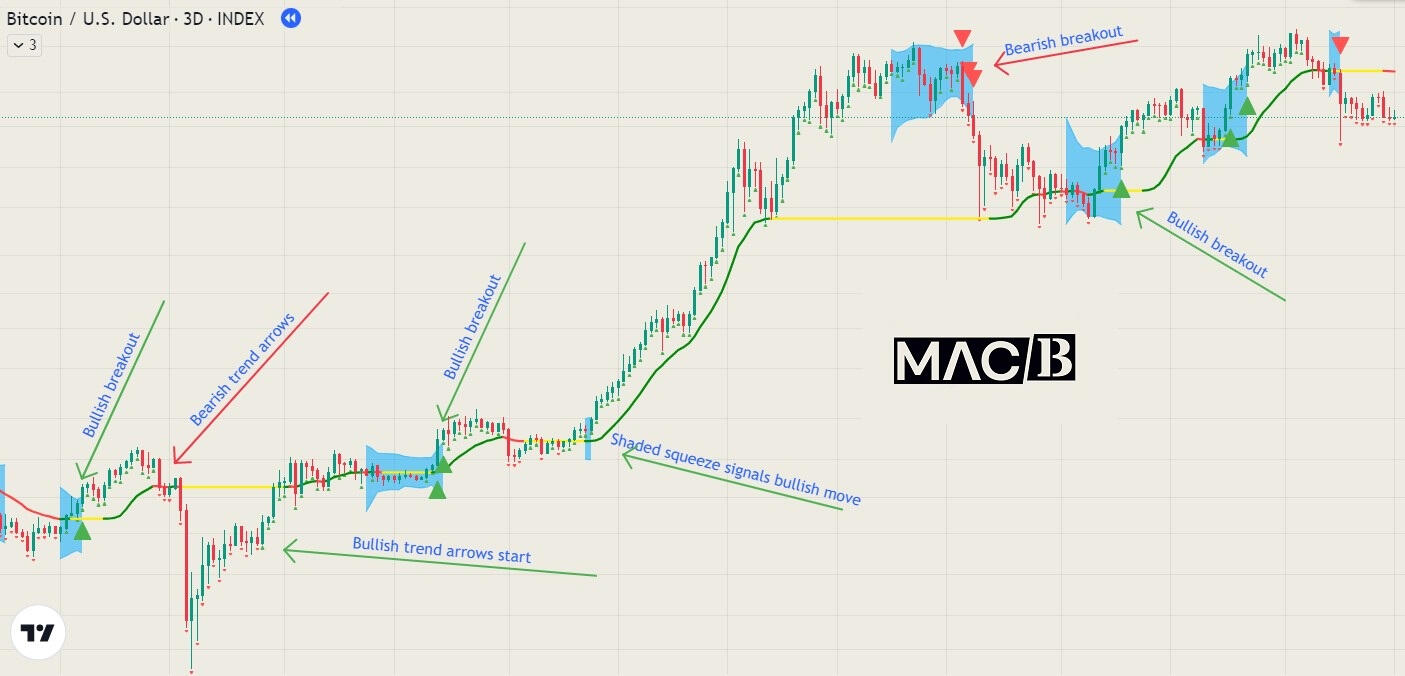
MACB Indicator is custom made core indicator used for crypto, stocks and forex. It is a base for creating very profitable trading strategies.Here I present main features of this indicator:
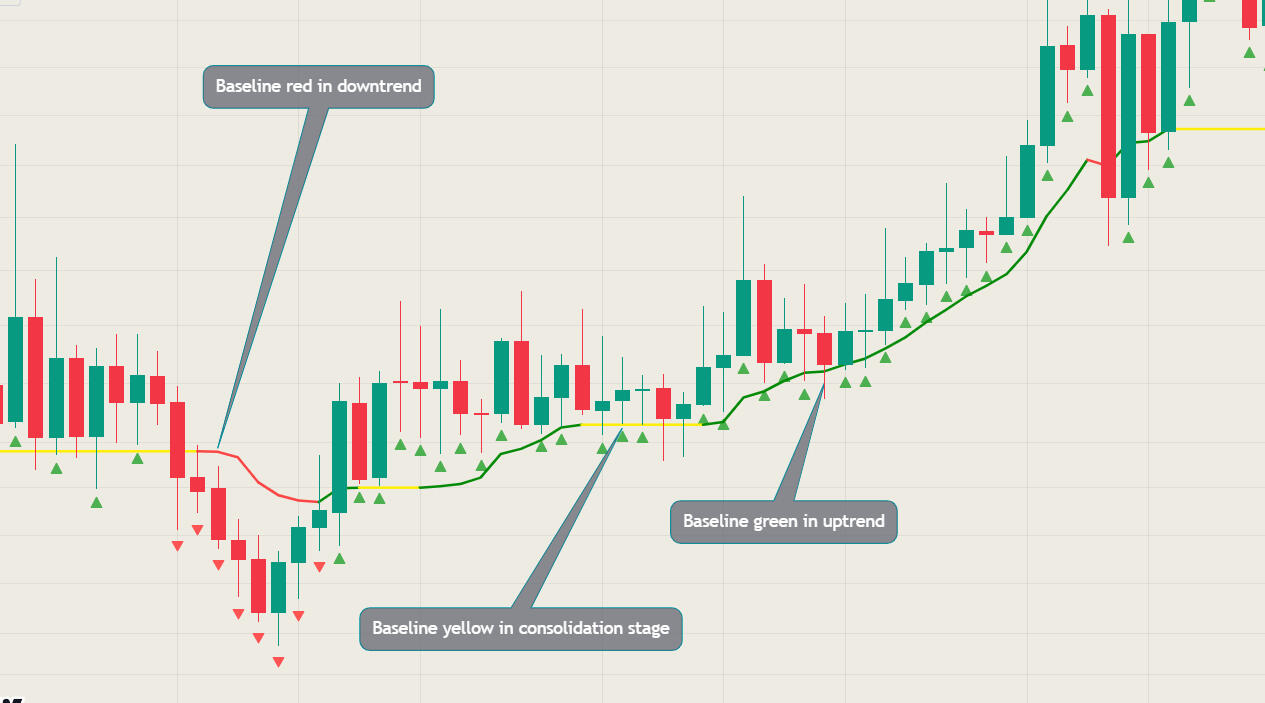
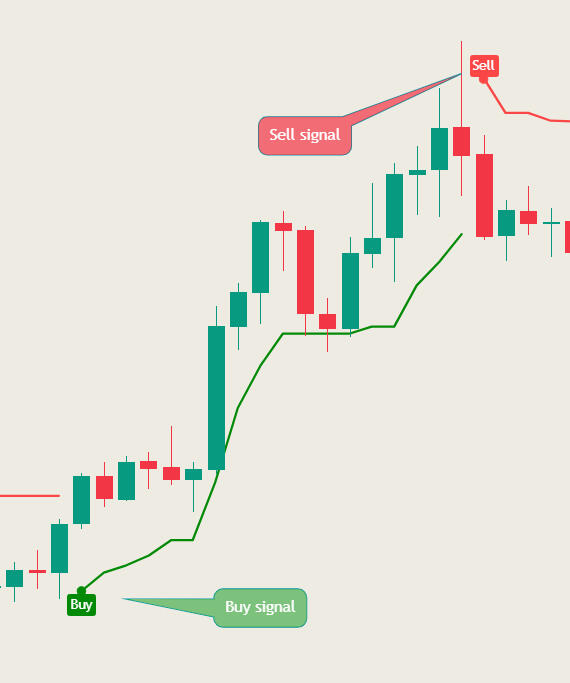
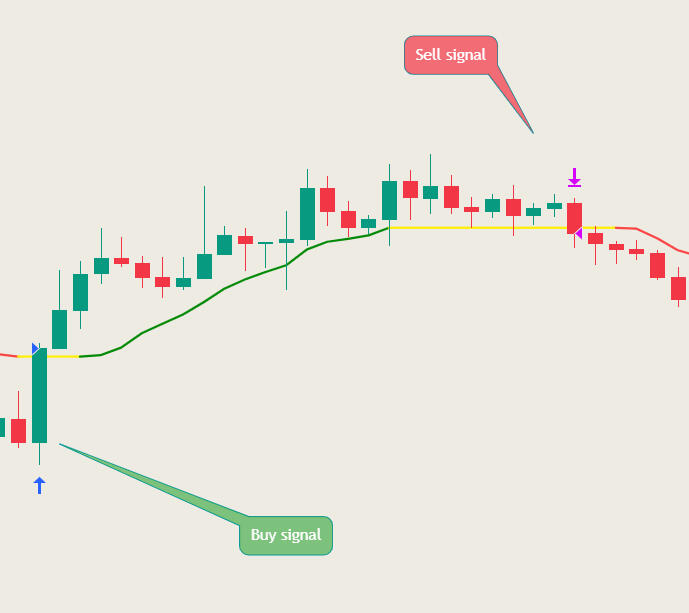
BASELINE
Acts as dynamic support/resistance level
Self-adjusting
Signals trend direction (uptrend, consolidation, downtrend)
Bars closing above - bullish
Bars closing below - bearish
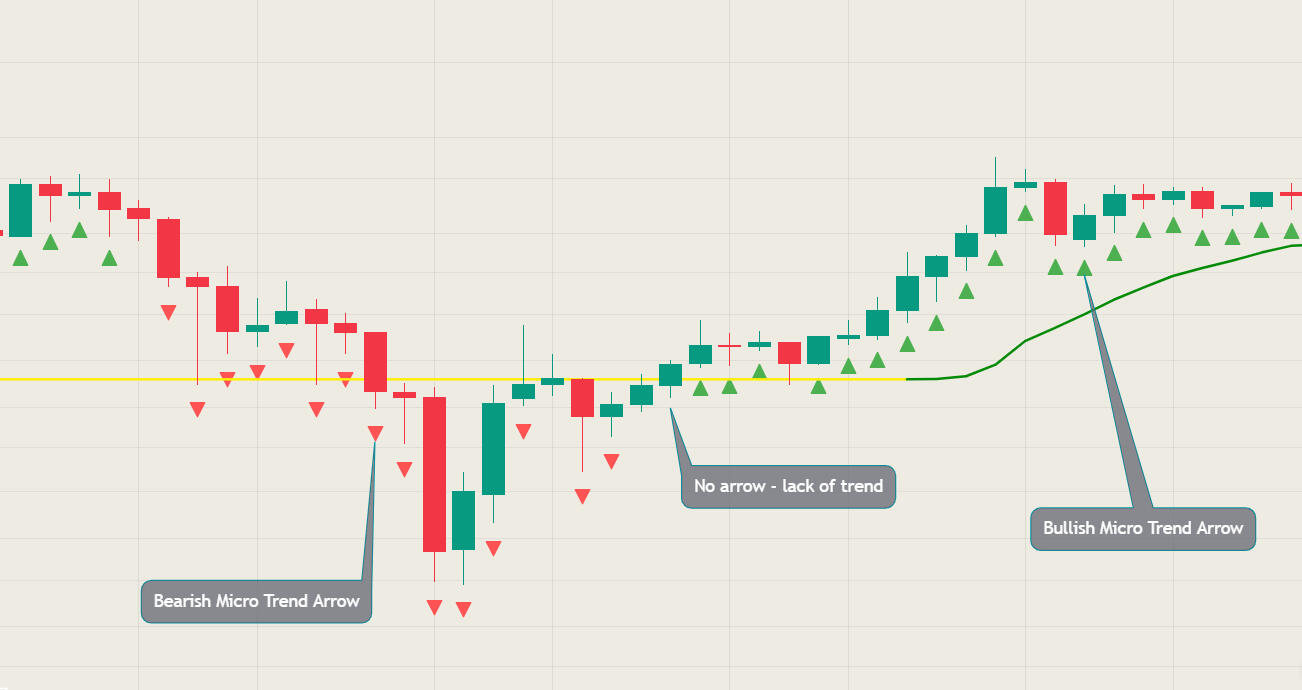
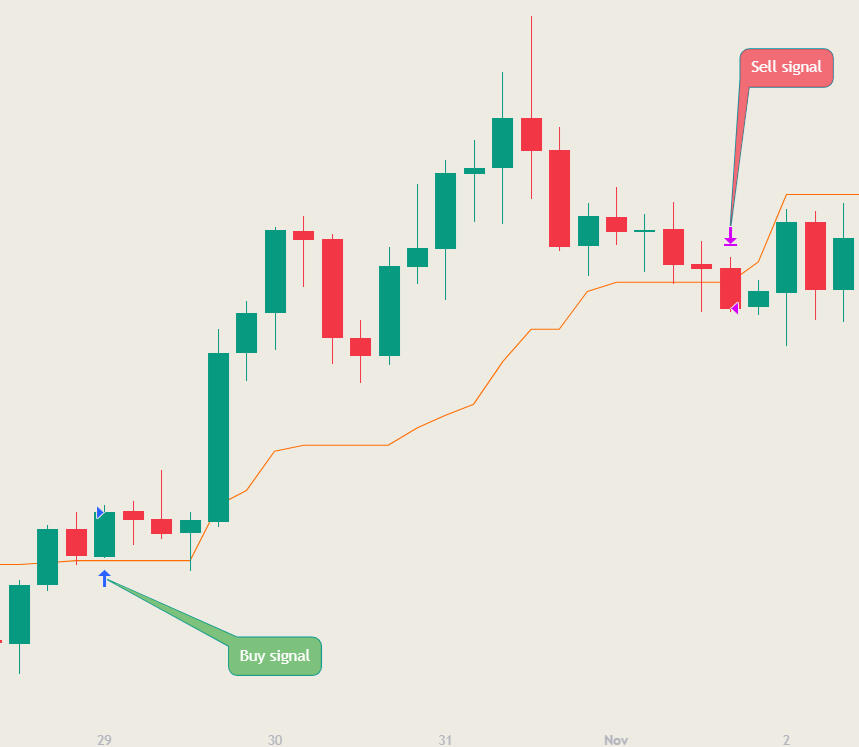
Micro Trend Arrows
Help you catch the direction of trend early
Green Arrows - bullish
Red Arrows - bearish
No Arrow - indecisive period
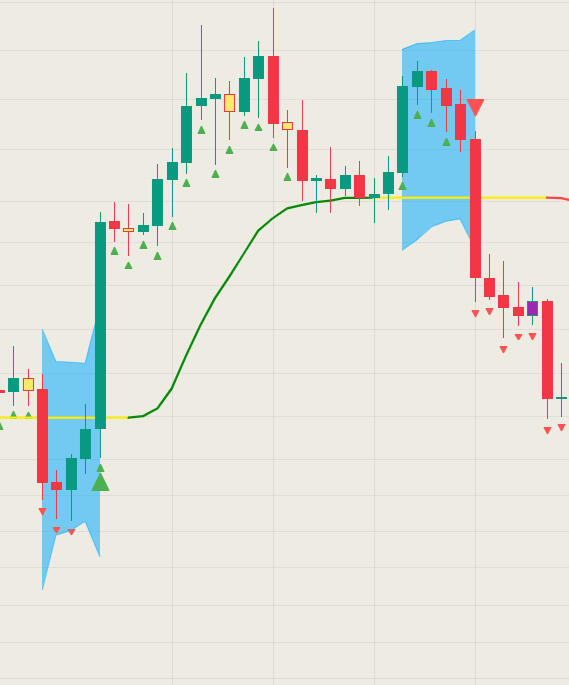
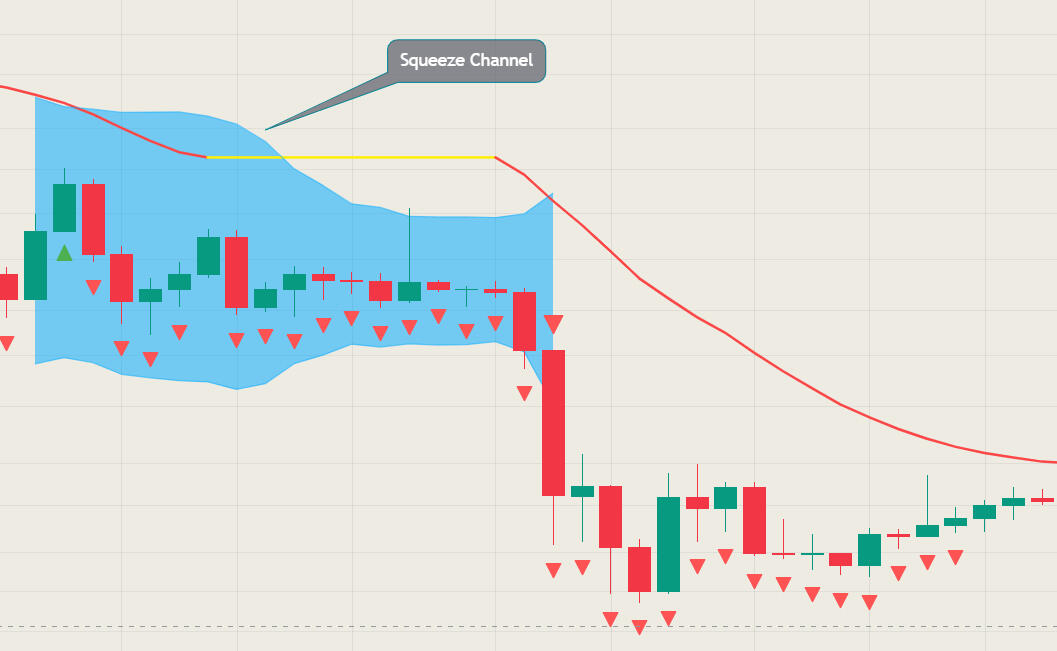
Squeeze Channels
Squeeze Channels form during consolidation periods. During that time price is "squeezed" in tight range.
When these squeezes are realeased - it often leads to powerful move
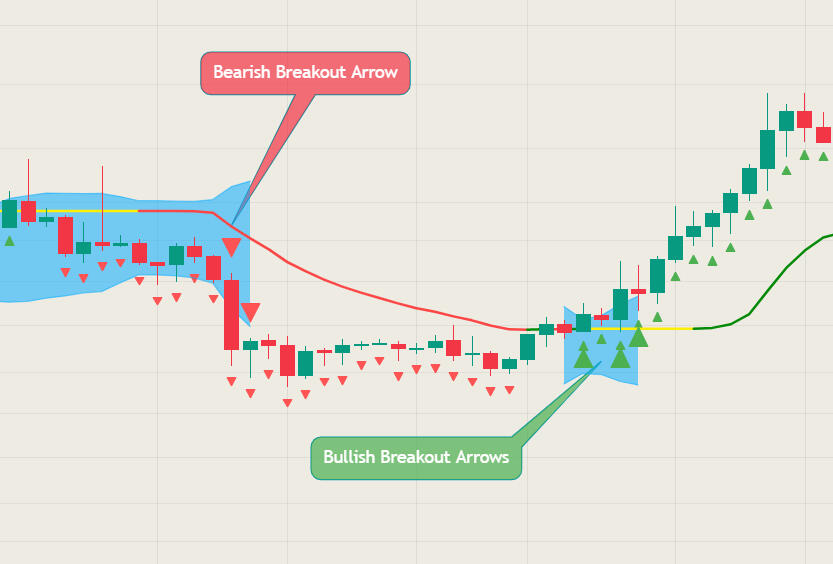
Breakout Arrows
The most violent moves happen during Breakout of Squeeze Channel
Breakouts can happen to the upside or to the downside
Breakouts are marked with big Breakout Arrow.
Micro Trend Arrows help you early identify most possible direction of Breakout.
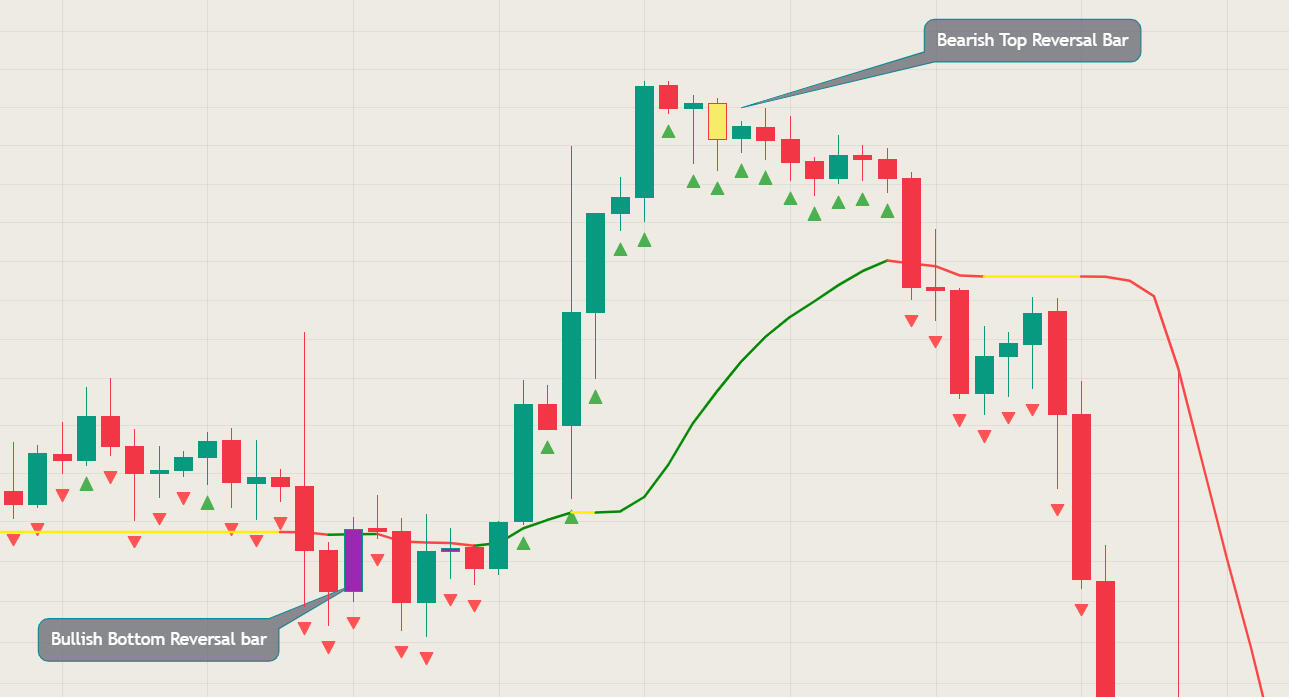
Reversal Bars
Yellow Bearish Reversal Bar
Purple Bullish Reversal Bars
Both are extremly accurate at finding POSSIBLE change of trend, even faster than Trend Arrows.
NOTE: Each Reversal Bar needs further confirmation for HIGH PROBABILITY - I explain in details in User Manual and tutorial videos.
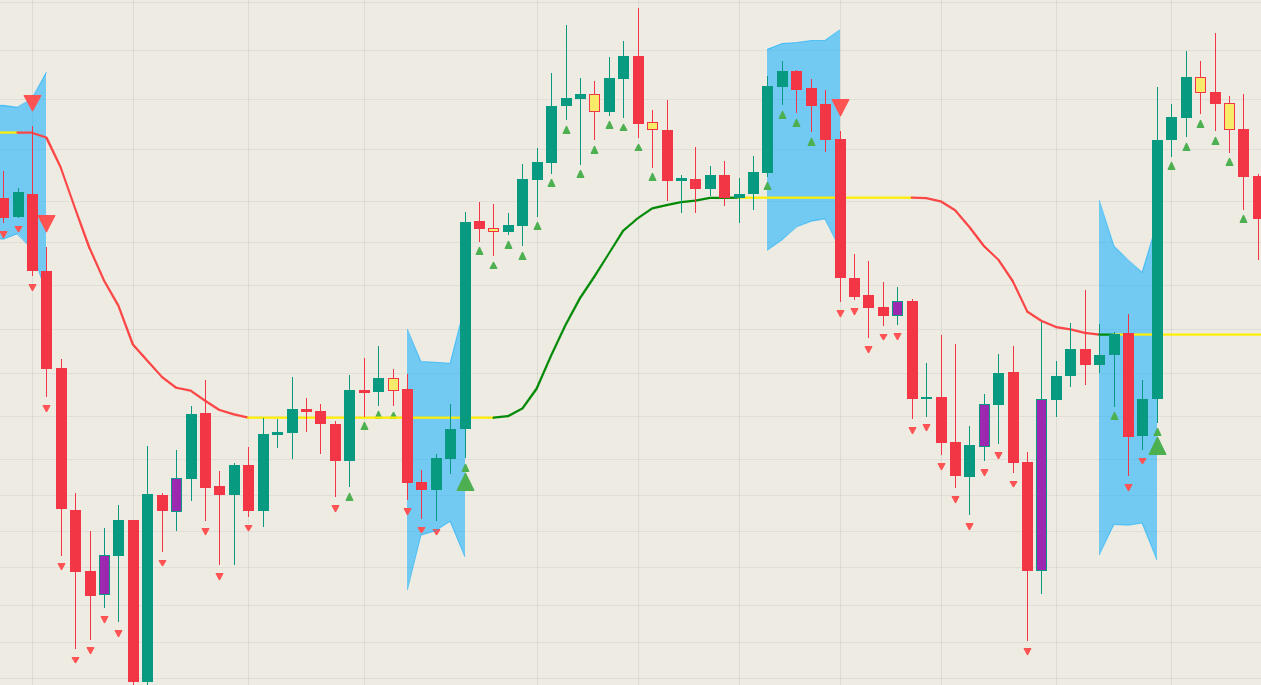
Combine all features for best results
Baseline
Micro Trend Arrows
Squeeze Channels
Breakouts
Reversal Bars
Historical snapshots on MACB indications:
MACB Strategy is a set of predefined strategies for trading crypto, stocks, forex. Below I present how using them outperforms market against just holding an asset for given period of time.
Additionaly now in MACB Strategy pack there is MACB Bottom Indicator included! Fenomenal solution for finding absolute best buying opportunities!
MACB Trend long strategy
| Strategy | Coin | Date | Profit | Strategy / HODL |
|---|---|---|---|---|
| MACB Trend Long (12H) | Bitcoin BTC | 01-01-2021 to 04-17-2023 | 52 % | 10,4 |
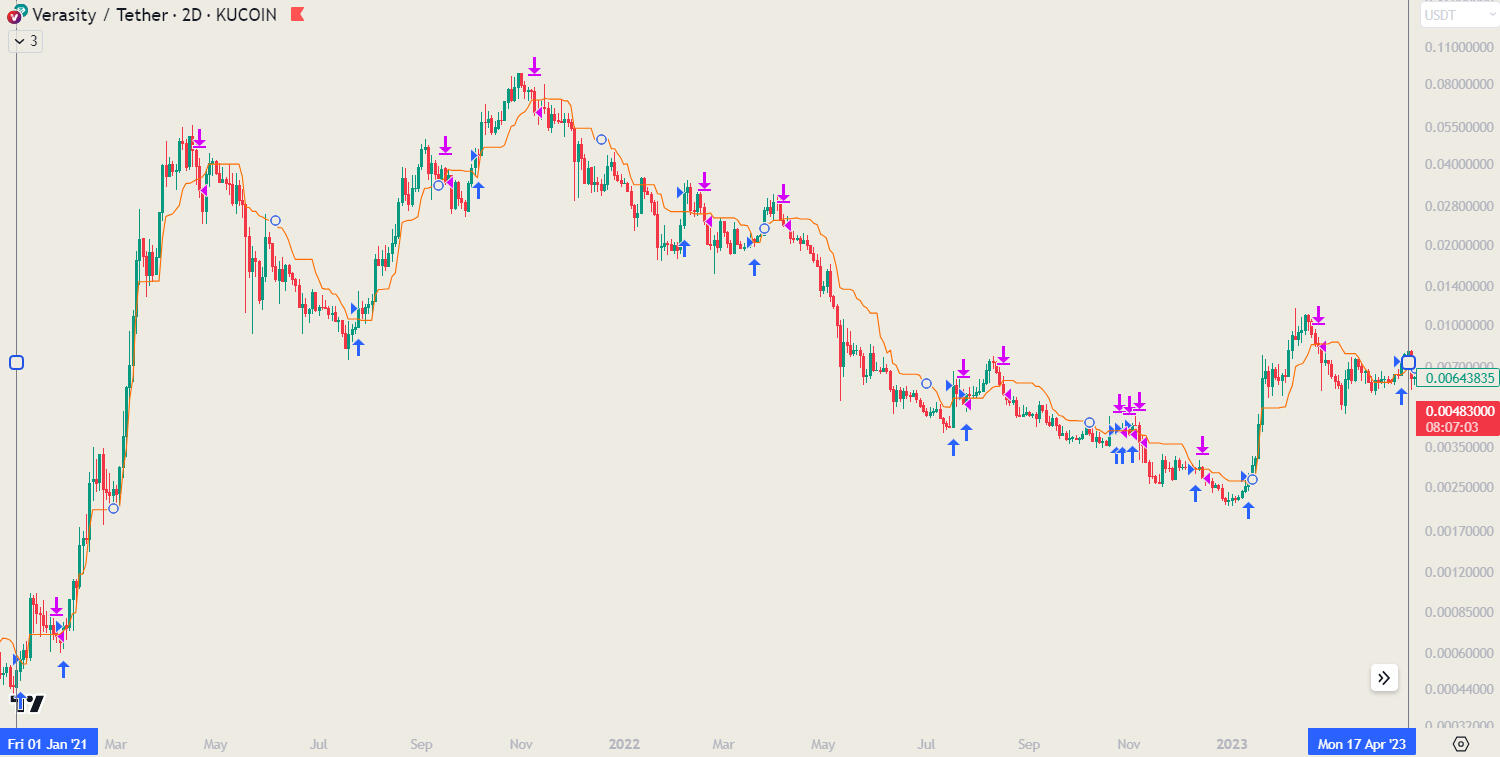
| MACB Trend Long (1D) | Verasity VRA | 01-01-2021 to 04-17-2023 | 38700% | 30,5 |
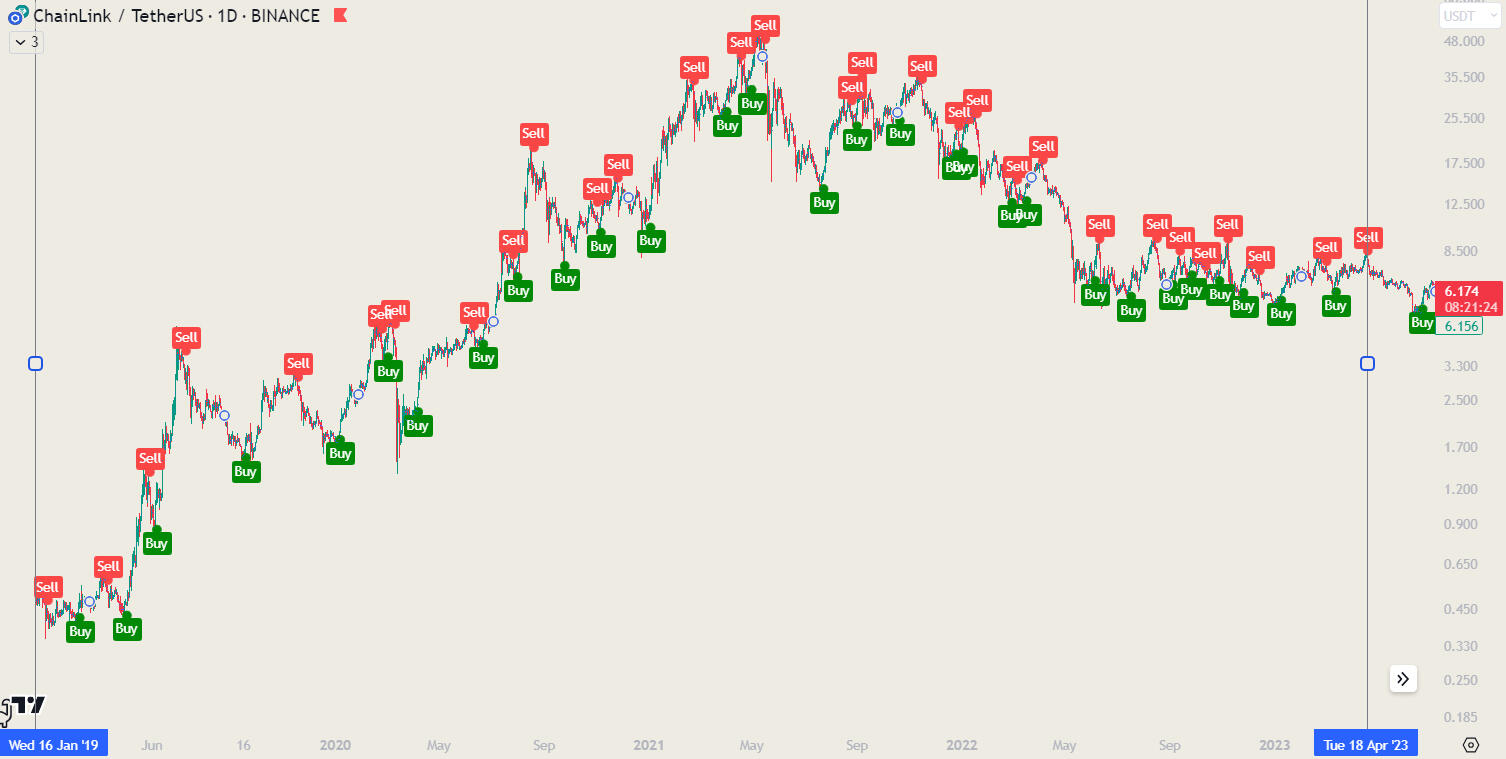
| MACB Trend Long (1D) | LINK Chainlink | 02-01-2019 to 04-17-2023 | 6740 % | 4,2 |
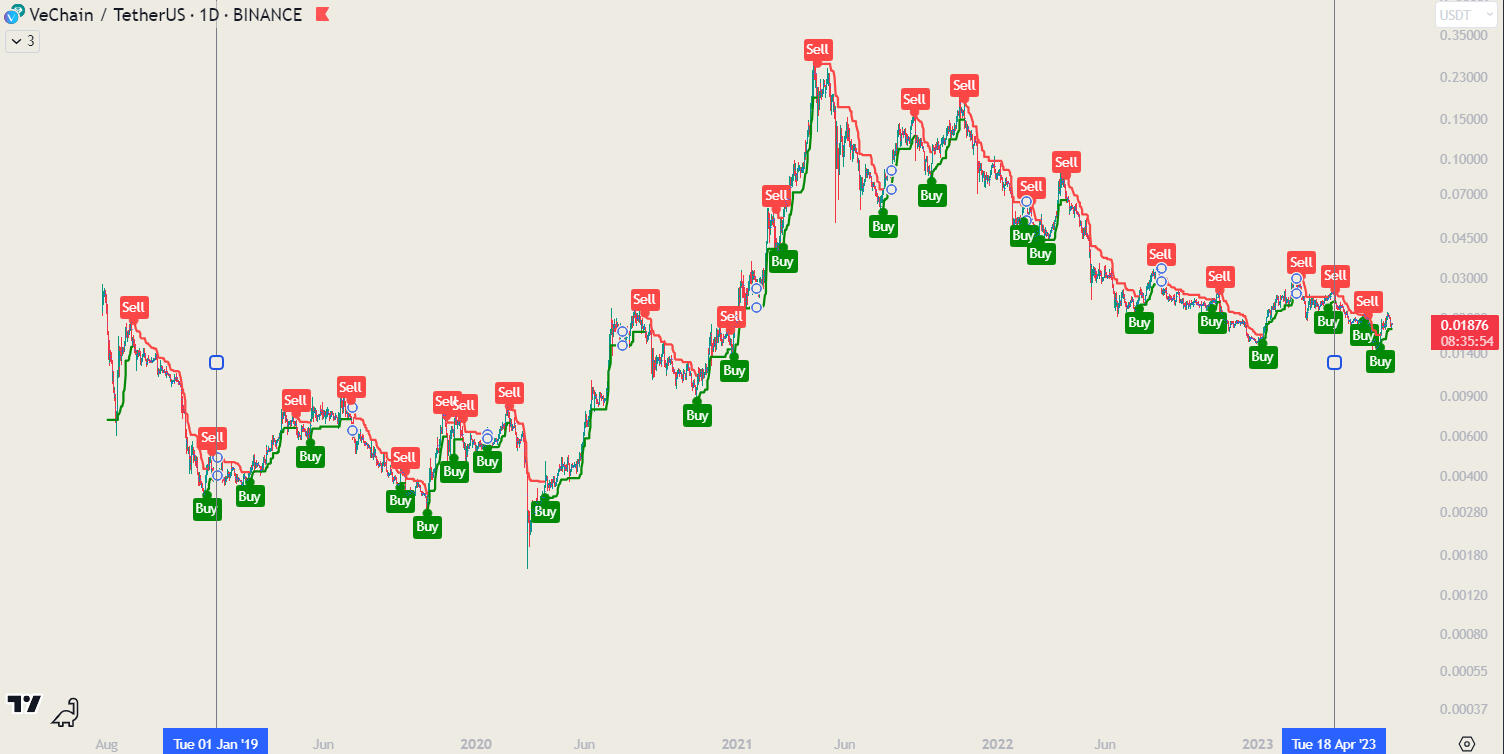
| MACB Trend Long (1D) | VET Vechain | 01-01-2019 to 04-17-2023 | 13200 % | 29,3 |
This strategy applied to cryptocurrencies like Bitcoin, Vechain, Verasity, XRP, AVAX, HBAR, Chainlink outperforms buying and holding by 4 - 29 times! It means you can outperform market significantly using the same initial investment.
All strategies included in our plans:
MACB Trend long and short strategy
If you are experienced trader and you are not affraid to short volatile markets like cryptocurrencies you can make significant more income using long and short strategy. Checkout profit factors in table below! Example Bitcoin chart here.
| Strategy | Coin | Date | Profit | Strategy / HODL |
|---|---|---|---|---|
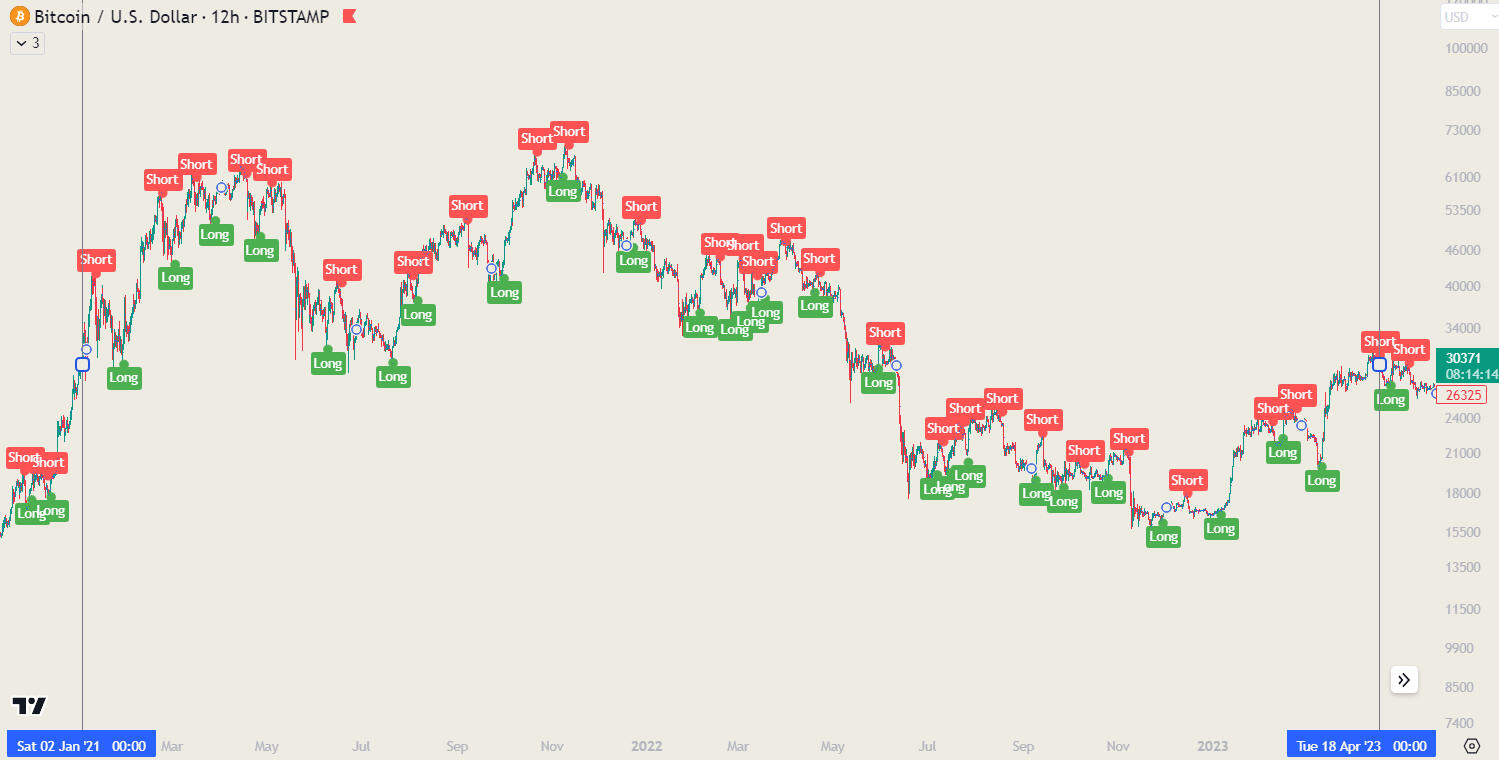
| MACB Trend Long and Short (12H) | Bitcoin BTC | 01-01-2021 to 04-17-2023 | 137 % | 27,4 |
| MACB Trend Long and Short (1D) | VET Vechain | 01-01-2019 to 04-17-2023 | 28800 % | 64 |
| MACB Trend Long and Short (2D) | LTC Litecoin | 01-01-2019 to 04-17-2023 | 1421 % | 7,1 |
| MACB Trend Long and Short (2D) | HBAR Hedera | 09-01-2019 to 04-17-2023 | 2328 % | 38,8 |
| MACB Trend Long and Short (1D) | Verasity VRA | 01-01-2021 to 04-17-2023 | 180000% | 141 |
| MACB Trend Long and Short (1D) | USD/PLN | 01-01-2019 to 04-17-2023 | 49,55 % | 4 |
| MACB Trend Long and Short (3D) | Meta/USD | 01-01-2021 to 04-17-2023 | 93 % | +93% vs -20% |
| MACB Trend Long and Short (1D) | Tesla/USD | 01-01-2021 to 04-17-2023 | 124 % | +124% vs -20% |
| MACB Trend Long and Short (2D) | Coinbase/USD | 01-01-2021 to 04-17-2023 | 69 % | +69% vs -81% |

All strategies included in our plans:
MACB Momentum long strategy
| Strategy | Coin | Date | Profit | Strategy / HODL |
|---|---|---|---|---|
| MACB Momentum Long (2D) | BTC Bitcoin | 01-01-2019 to 04-17-2023 | 1723 % | 2,6 |
| MACB Momentum Long (2D) | ETH Ethereum | 01-01-2019 to 04-17-2023 | 3620 % | 2,6 |
| MACB Momentum Long (1D) | XRP | 01-01-2019 to 04-17-2023 | 606 % | 13,5 |
| MACB Momentum Long (12H) | XRP | 01-01-2017 to 04-17-2023 | 175800% | 25,5 |
| MACB Momentum Long (2D) | VRA Verasity | 01-01-2021 to 04-17-2023 | 39000% | 30,7 |
| MACB Momentum Long (3D) | BNB Bainance Coin | 01-01-2021 to 04-17-2023 | 2212 % | 2,8 |
| MACB Momentum Long (1D) | ADA Cardano | 01-01-2019 to 04-17-2023 | 6575 % | 8,2 |
| MACB Momentum Long (2D) | FTM Fantom | 06-01-2019 to 04-17-2023 | 32700 % | 15,2 |
| MACB Momentum Long (2D) | HBAR Hedera | 09-01-2019 to 04-17-2023 | 1009 % | 16,8 |
This strategy applied to cryptocurrencies like Bitcoin, Vechain, Verasity, XRP, AVAX, HBAR, Chainlink outperforms buying and holding by 1,9 - 30,7 times! It means you can outperform market significantly using the same initial investment.

All strategies included in our plans:
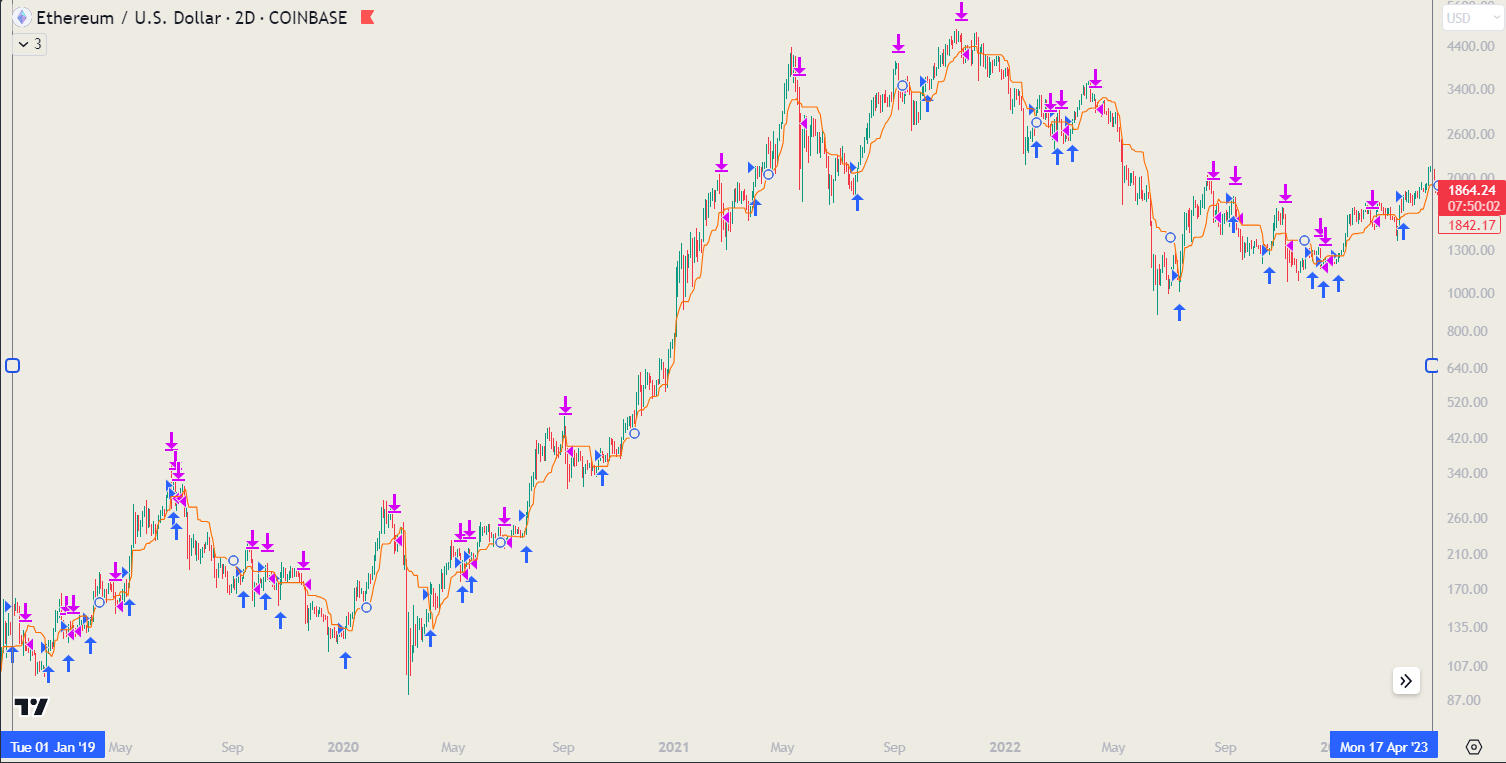
MACB Momentum long and short strategy results:
If you are experienced trader and you are not affraid to short volatile markets like cryptocurrencies you can make significant more income using long and short strategy. Checkout profit factors in table below!
Example chart of Ethereum here.
| Strategy | Coin | Date | Profit | Strategy / HODL |
|---|---|---|---|---|
| MACB Momentum Long and Short (2D) | BTC Bitcoin | 01-01-2019 to 04-17-2023 | 3129 % | 4,7 |
| MACB Momentum Long and Short (2D) | ETH Ethereum | 01-01-2019 to 04-17-2023 | 3521 % | 2,5 |
| MACB Momentum Long and Short (1D) | ADA Cardano | 01-01-2019 to 04-17-2023 | 10277% | 12,8 |
| MACB Momentum Long and Short (1D) | XRP | 01-01-2019 to 04-17-2023 | 1100 % | 24,4 |
| MACB Momentum Long and Short (2D) | VRA Verasity | 01-01-2021 to 04-17-2023 | 83966% | 66,1 |
| MACB Momentum Long and Short (3D) | BNB Bainance Coin | 01-01-2021 to 04-17-2023 | 5400 % | 6,9 |
All strategies included in our plans:
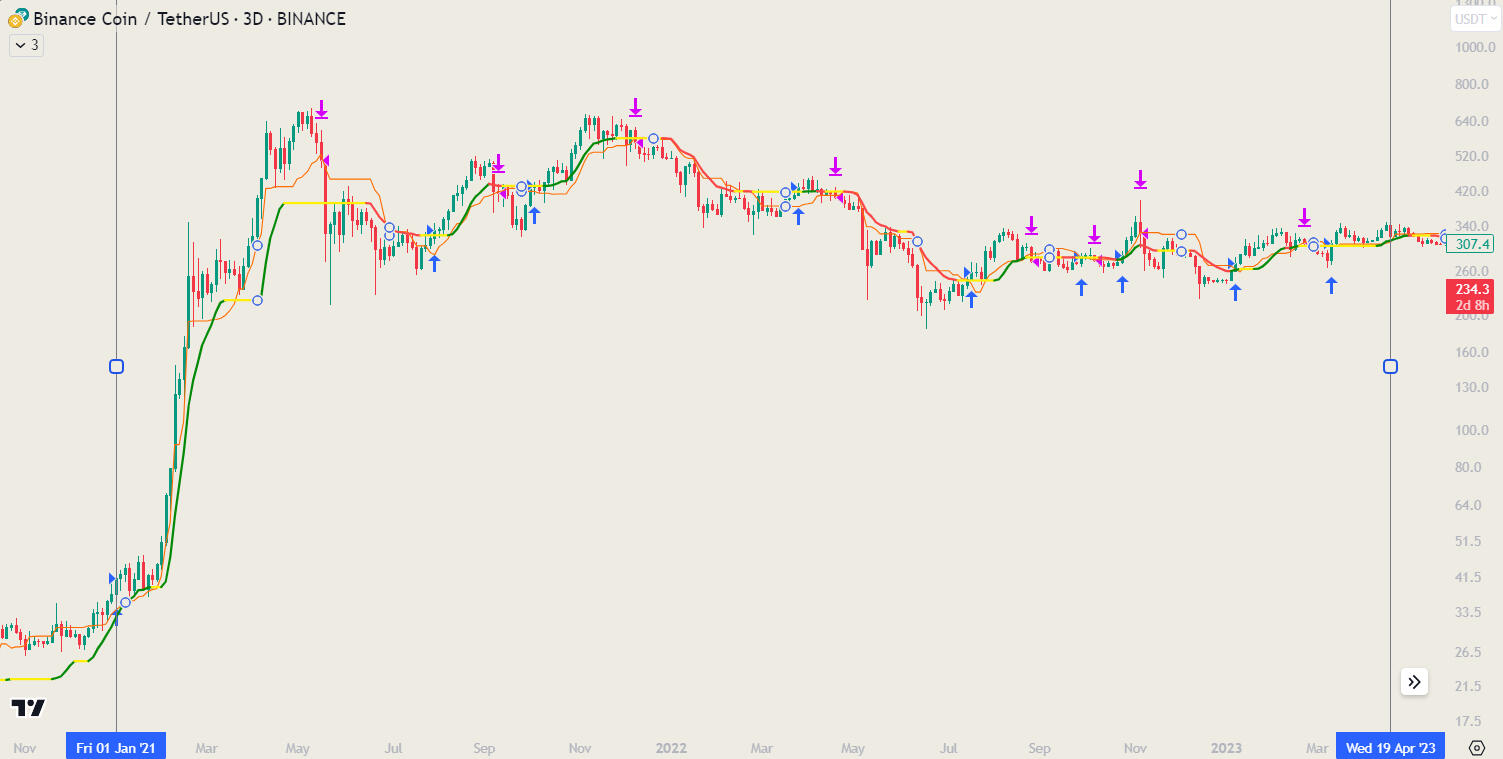
DC MACB long strategy results:
| Strategy | Coin | Date | Profit | Strategy / HODL |
|---|---|---|---|---|
| DC MACB Long (3D) | FTM Fantom | 06-01-2019 to 04-17-2023 | 18860 % | 8,8 |
| DC MACB Long (12H) | XRP | 01-01-2017 to 04-17-2023 | 72500 % | 10,5 |
| DC MACB Long (2D) | HBAR Hedera | 09-01-2019 to 04-17-2023 | 1092 % | 18,2 |
| DC MACB Long (3D) | BNB Binance Coin | 01-01-2021 to 04-17-2023 | 2385 % | 3,1 |
| DC MACB Long (3D) | EUR USD | 01-01-2019 to 04-17-2023 | 9,5 % | +9,5% vs -4 |
This strategy applied to cryptocurrencies like Bitcoin, Vechain, Verasity, XRP, AVAX, HBAR, Chainlink outperforms buying and holding by 4 - 29 times! It means you can outperform market significantly using the same initial investment. Example Binance Coin chart here

All strategies included in our plans:
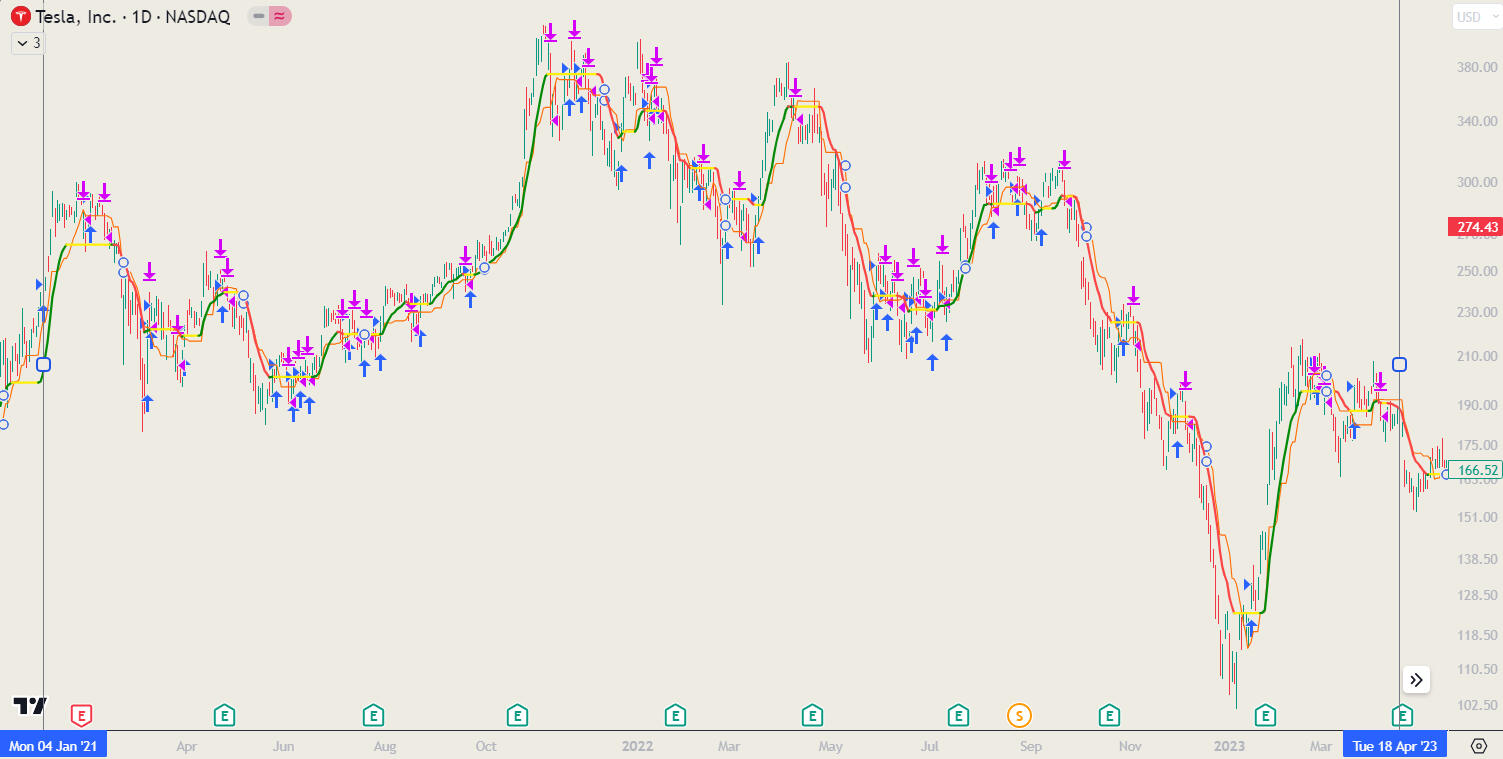
DC MACB long and short strategy results:
| Strategy | Coin | Date | Profit | Strategy / HODL |
|---|---|---|---|---|
| DC MACB Long and Short (1D) | Tesla/USD | 01-01-2021 to 04-17-2023 | 231 % | +231% vs -20% |
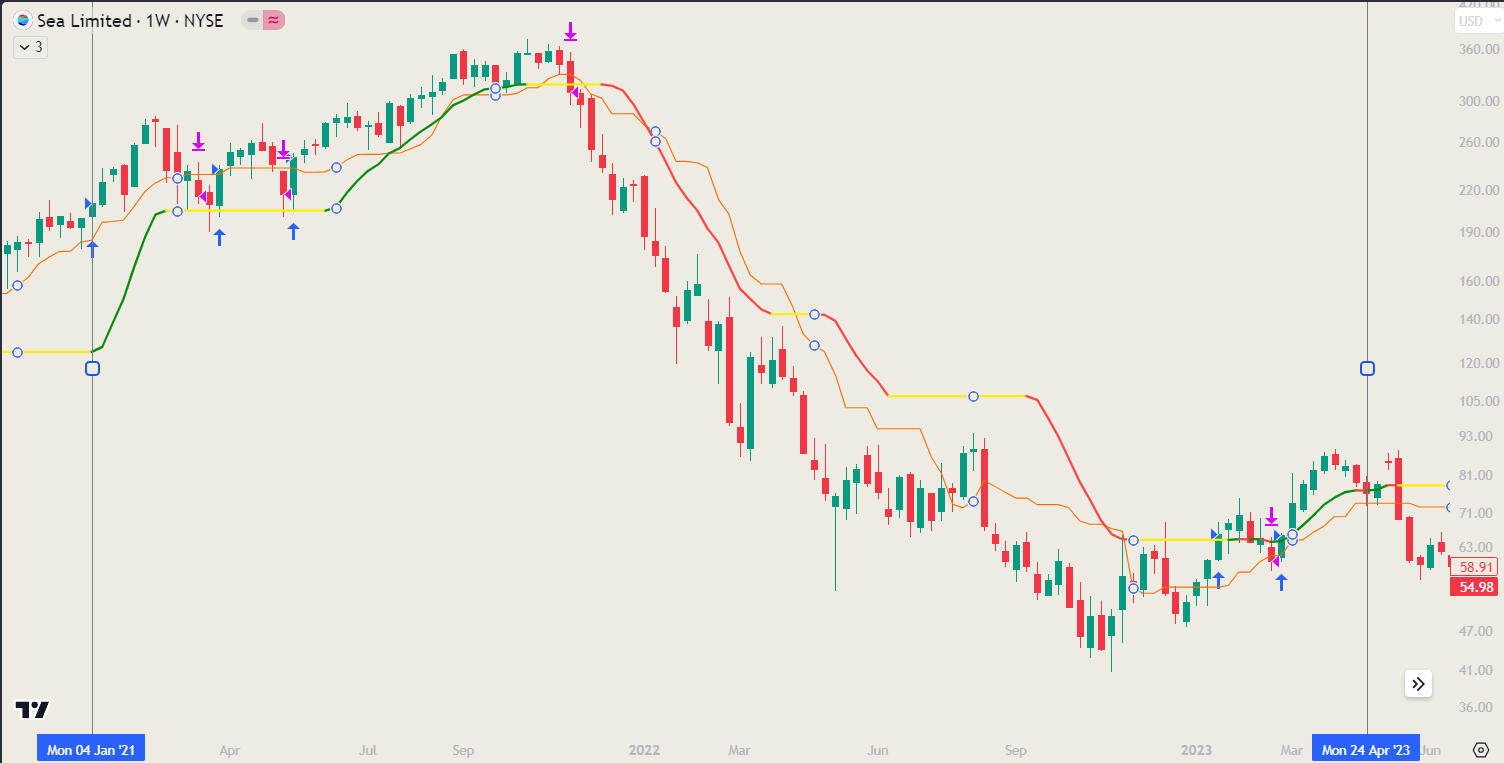
| DC MACB Long and Short (1W) | SeaLimited/USD | 01-01-2021 to 04-17-2023 | 92 % | +92% vs -60% |
| DC MACB Long and Short (3D) | Netflix/USD | 01-01-2021 to 04-17-2023 | 53 % | +53% vs -40% |
| DC MACB Long and Short (3D) | Coinbase/USD | 01-01-2021 to 04-17-2023 | 89 % | +89% vs -81% |
Good strategy for trading major stocks.
Example Tesla chart here
Example Sea Limited chart here - 1W chart for longer term investors.
All strategies included in our plans:
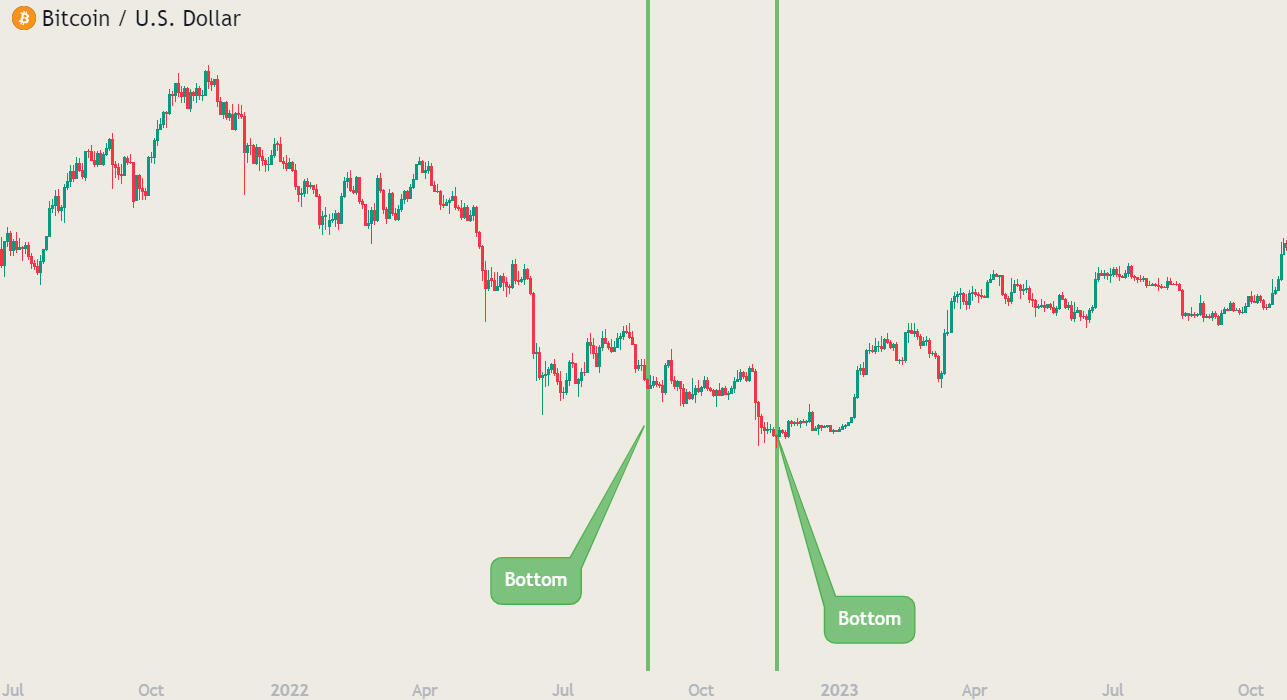
MACB Bottom Indicator
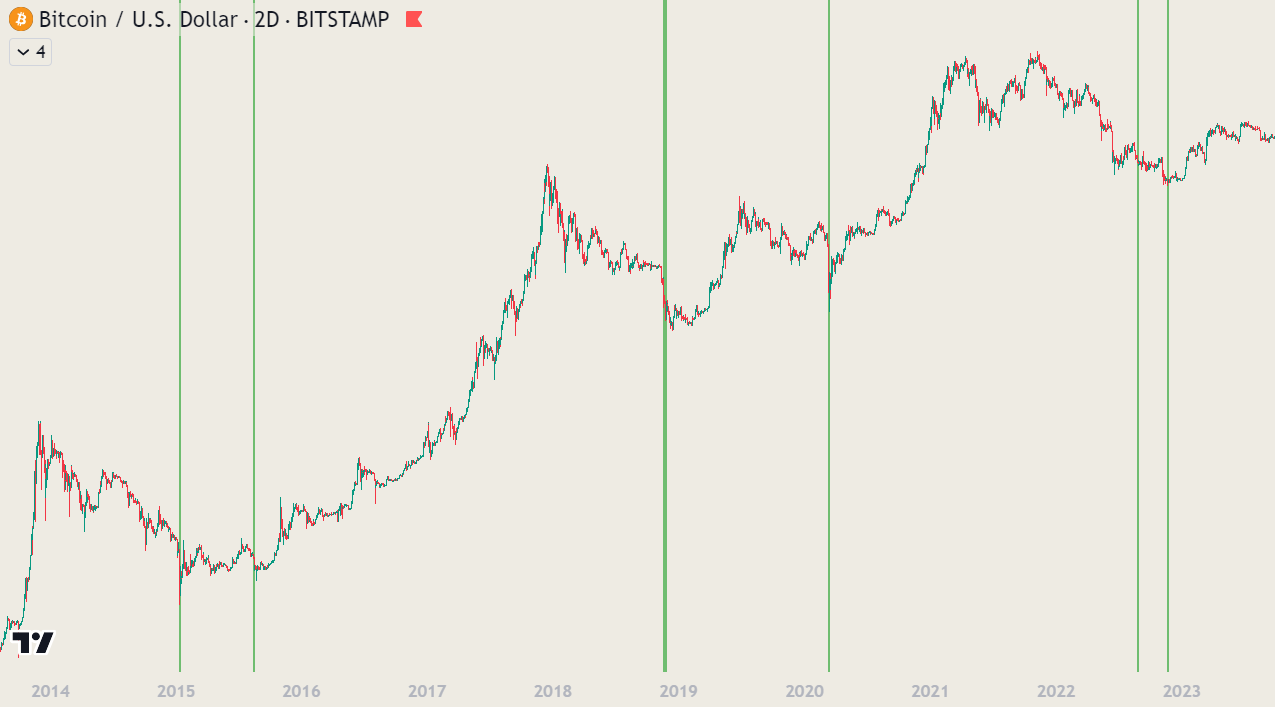
Absolutely phenomental tool identifying best buying opportunities for major cryptocurrencies and stocks, for long term investments.Example chart of Bitcoin here.
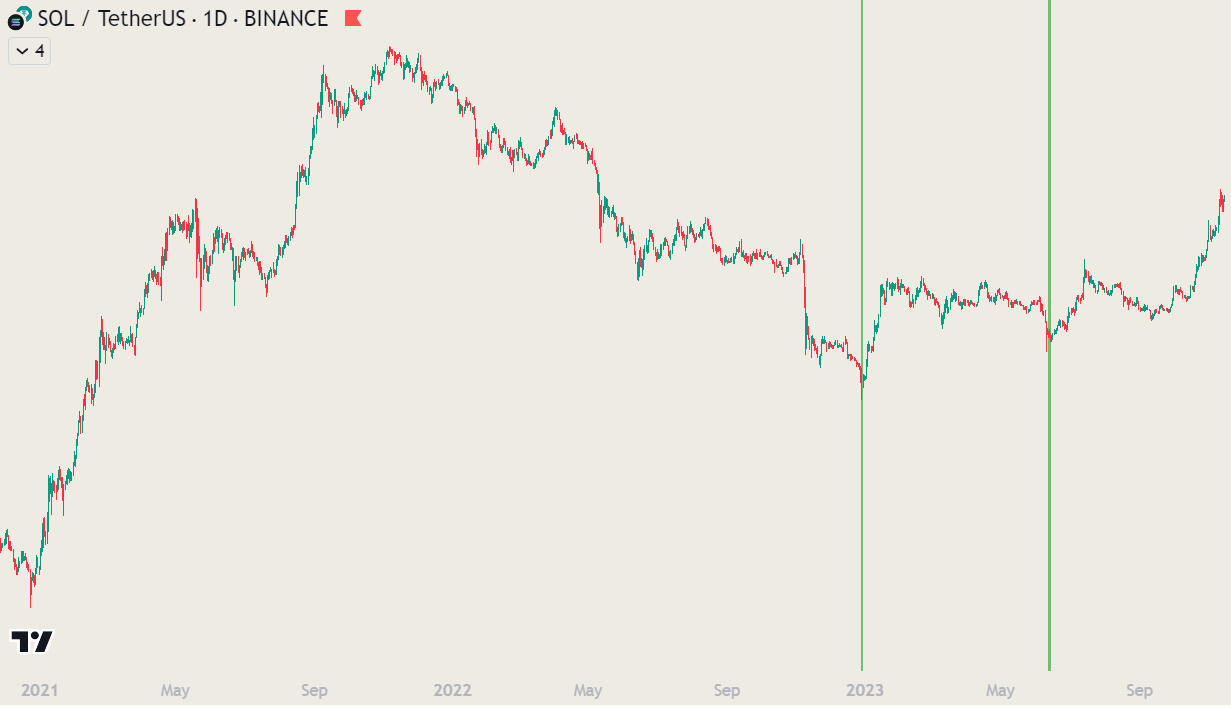
Example chart of Solana here.
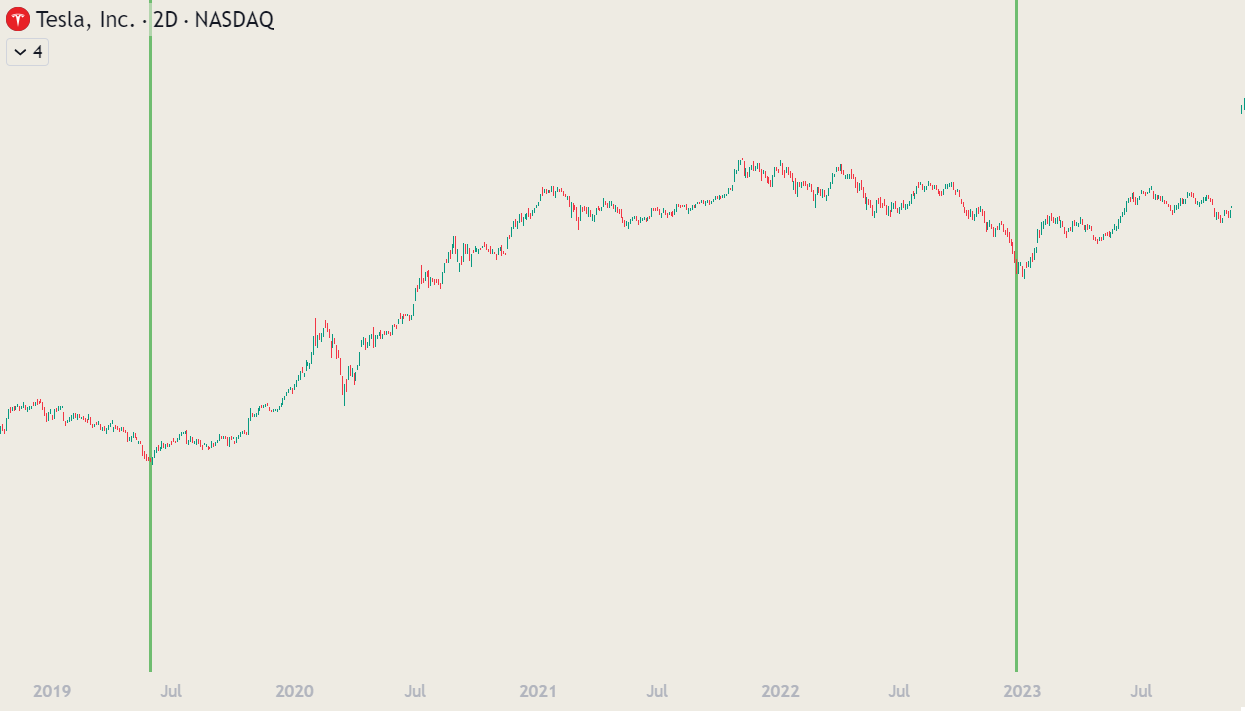
Example chart of Tesla here.
List of included cryptocurrencies:
BTC, ETH, VET, VRA, TRIAS, TEL, LTC, DOGE, TFUEL, HBAR, DOT, ADA, FET, EGLD, SOL, SHIB, CHZ, ICX, XRP, XLM, BNB, AAVEList of other assets:
META, NFLX, AAPL, TSLA, AMD, NVDA, NIFTY50, BANKNIFTY, DIS
All strategies included in our plans:
Thank you
MACB Trend long only strategy applied to Chainlink 1D chart gives 6740% profit in period of time between 02-01-2019 and 04-17-2023:
MACB Trend long only strategy applied to Vechain 1D chart gives 13200% profit in period of time between 01-01-2019 and 04-17-2023:
MACB Trend long and short strategy applied to Bitcoin 12H chart gives 137% profit in period of time between 01-01-2021 and 04-17-2023:
MACB Momentum long strategy applied to Verasity 2D chart gives 39000% profit in period of time between 01-01-2021 and 04-17-2023. With possibility to short on sell signals it is possible to reach 95000% profit!
MACB Momentum long and short strategy applied to Ethereum 2D chart gives 3521% profit in period of time between 01-01-2019 and 04-17-2023:
MACB DC long strategy applied to Binance Coin 3D chart gives 2385% profit in period of time between 01-01-2021 and 04-17-2023:
MACB DC long and short strategy applied to Tesla 1D chart gives 231% profit in period of time between 01-01-2021 and 04-17-2023:
MACB DC long and short strategy applied to Sea Limited USD 1 week chart gives 92% profit (instead of -60% while holding) in period of time between 01-01-2021 and 04-17-2023 :
MACB Bottom Indicator on Bitcoin chart - indications for best buying opportunities in every of 4 year BTC cycles between 2015 and 2023. Each time buying at that indications would be very profitable in the future.
MACB Bottom Indicator on Solana chart - indications for best buying opportunities in 2023
MACB Bottom Indicator on Tesla USD chart - indications for best buying opportunities

Hello and welcome!
I am MacB - founder of MACB Indicator and CEO of MacB Trading.After years of studying financial markets I understood that there are more people like me, who want easy solution for this complex issue of trading. I believe that technical analysis can benefit any trader or investor way more than following the news, influencers or "gurus" of economy/trading/investing.I spent YEARS researching available solutions, looking for an indicator which could lead the way. There are some valuable tools already, but they are not affordable for an average person, nor user frendly. Typically they are priced about 1000$/year.I deceided to build this incredible indicator and offer it to you for a fraction of that price. I want to give people an opportunity which I didn't have once I started in this industry. Instead of paying for monthly or yearly subscription - you can make one time payment FOR LIFE and enjoy this powerful tool.
You are welcome! :)
MACB Indicator is based on:
Trend following
Technical analysis front running the "news"
Cycle nature of markets
Price compression leading to powerful breakouts
I made sure following MACB Indicator you could:
Avoid "black swan" events or crashes. Take a look at example charts where I describe how can you front run events like "corona dump", LUNA collapse, FTX crash, etc. You can actually use them for your benefit, instead of getting rekt!
Front run many market news. It happens very often that price moves before major news get to the public. This is due to "insider trading" causing price movements.
"The four most dangerous words in investing are: 'this time it's different.'" Past performance doesn't guarantee future results, yet one can assume that history teaches us valuable lessons.
History doesn't repeat, but it often rhymes.
"Show me the charts - I will tell you the news". Studying charts of historical assets has led me to the observation that price action often front runs news and global narratives. This behavior may have many underlying reasons, such as insider trading. As a result, it is often possible to notice the beginning of a trend before major news comes out or the media catches up.
Historical snapshots on MACB indications:
Bitcoin
BTC/USD 3D chart
3 day chart works good for swing traders and people who like to take more trades than long time investors. You can see how MACB indicator gives heads-up before major moves and trend changes. If you are swing trader - you can not miss these moves!
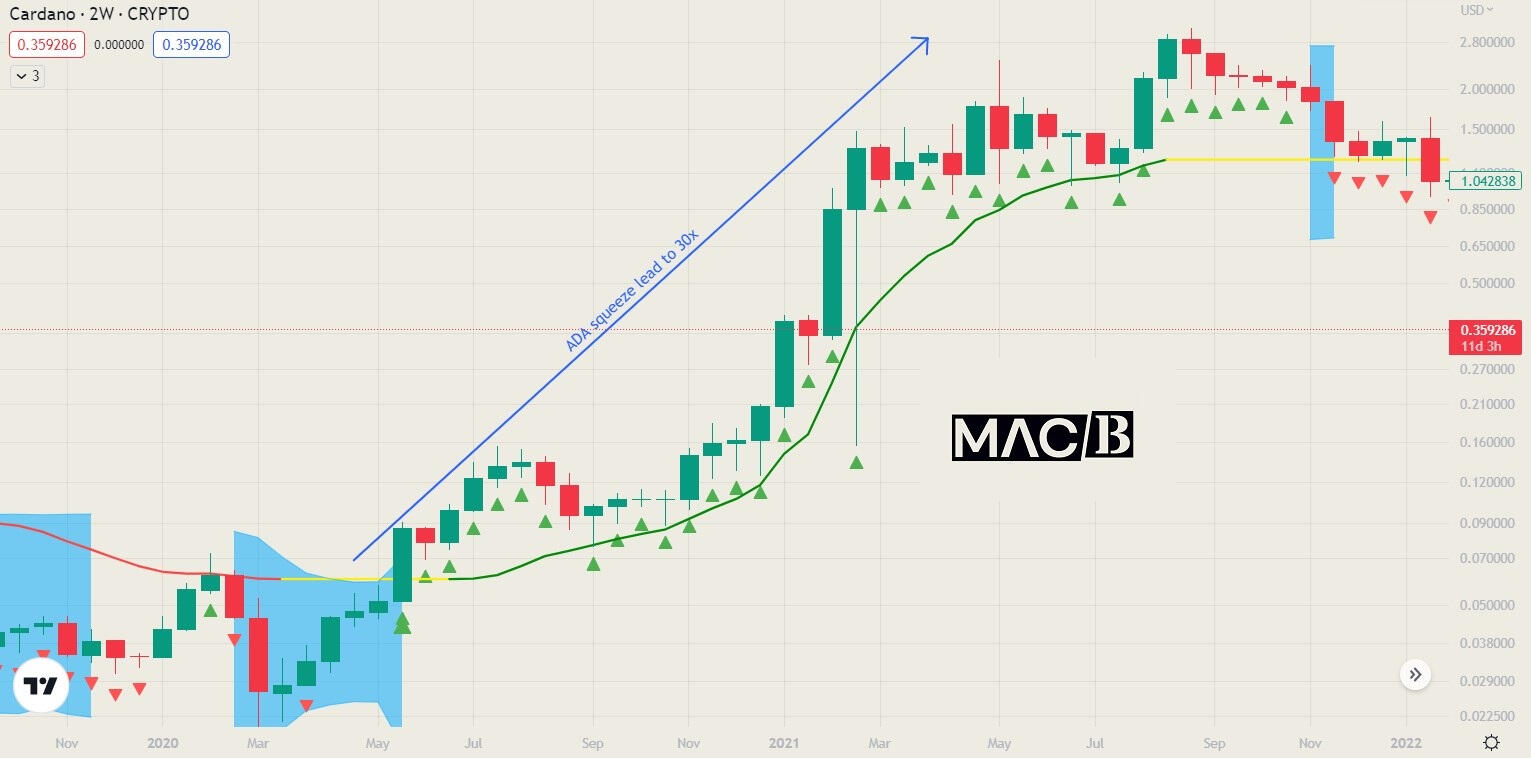
Cardano
ADA/USD 2W chart
In 2020 Cardano printed big breakout arrow after period of consolidation and squeeze
Move was signaled by big breakout arrow
MACB keeps you in the move with Trend Arrows
Leading to 30x gain!
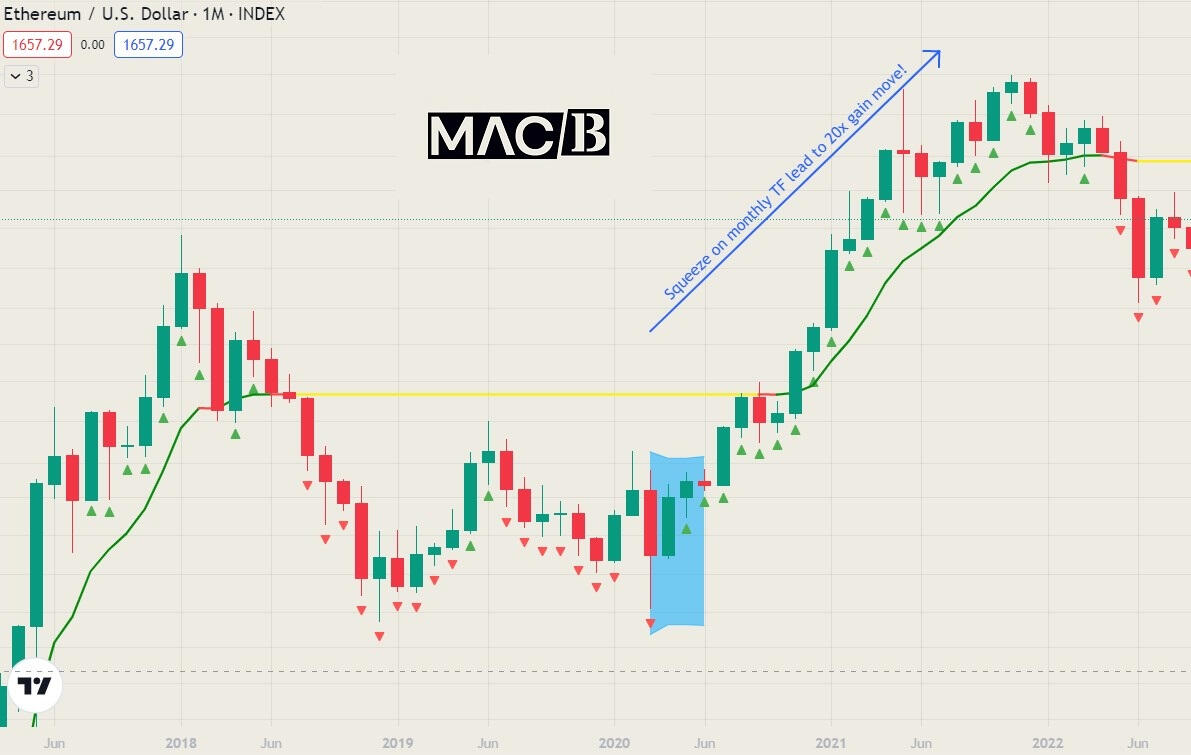
Ethereum
ETH/USD 1M chart
In 2020 ETH showed squeeze on monthly timeframe. You can see bullish trend arrows signaling bullish move coming. ETH ended up doing 20x in that move.
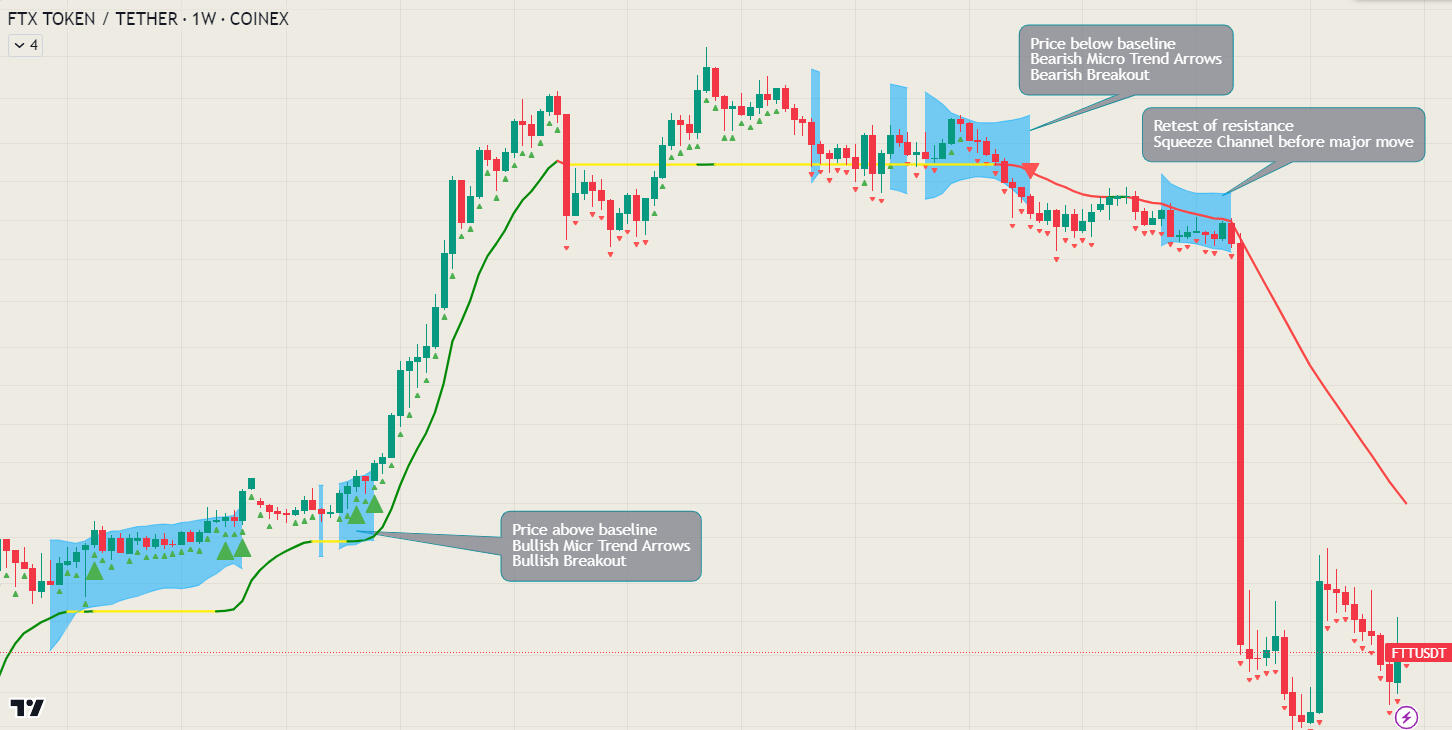
FTX token
FTT/USD 1W chart
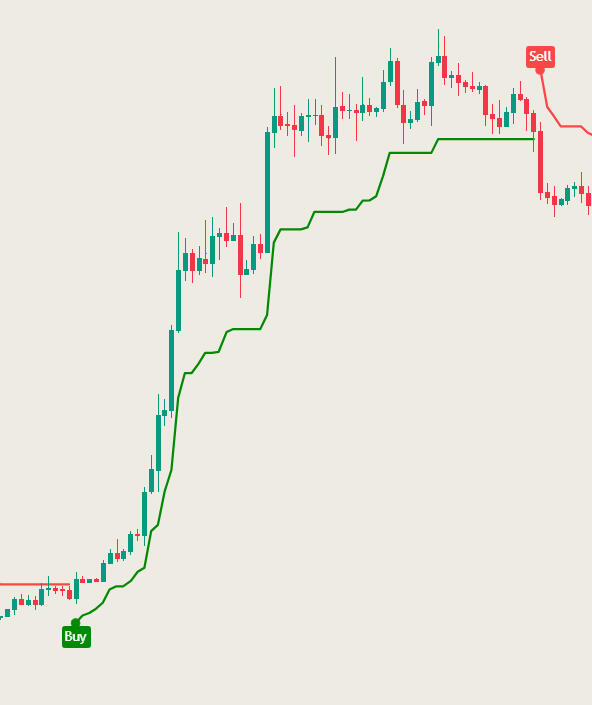
Following simplest rules of...
longing price action above Baseline
shorting price action below Baseline
expecting strong moves after Squeeze Channels
...would give you enough information to actually benefit from FTX collapse, rather than getting rekt. Each time Micro Trend Arrows were leading the way. You would be safe trading many timeframes like 1W-1D etc.
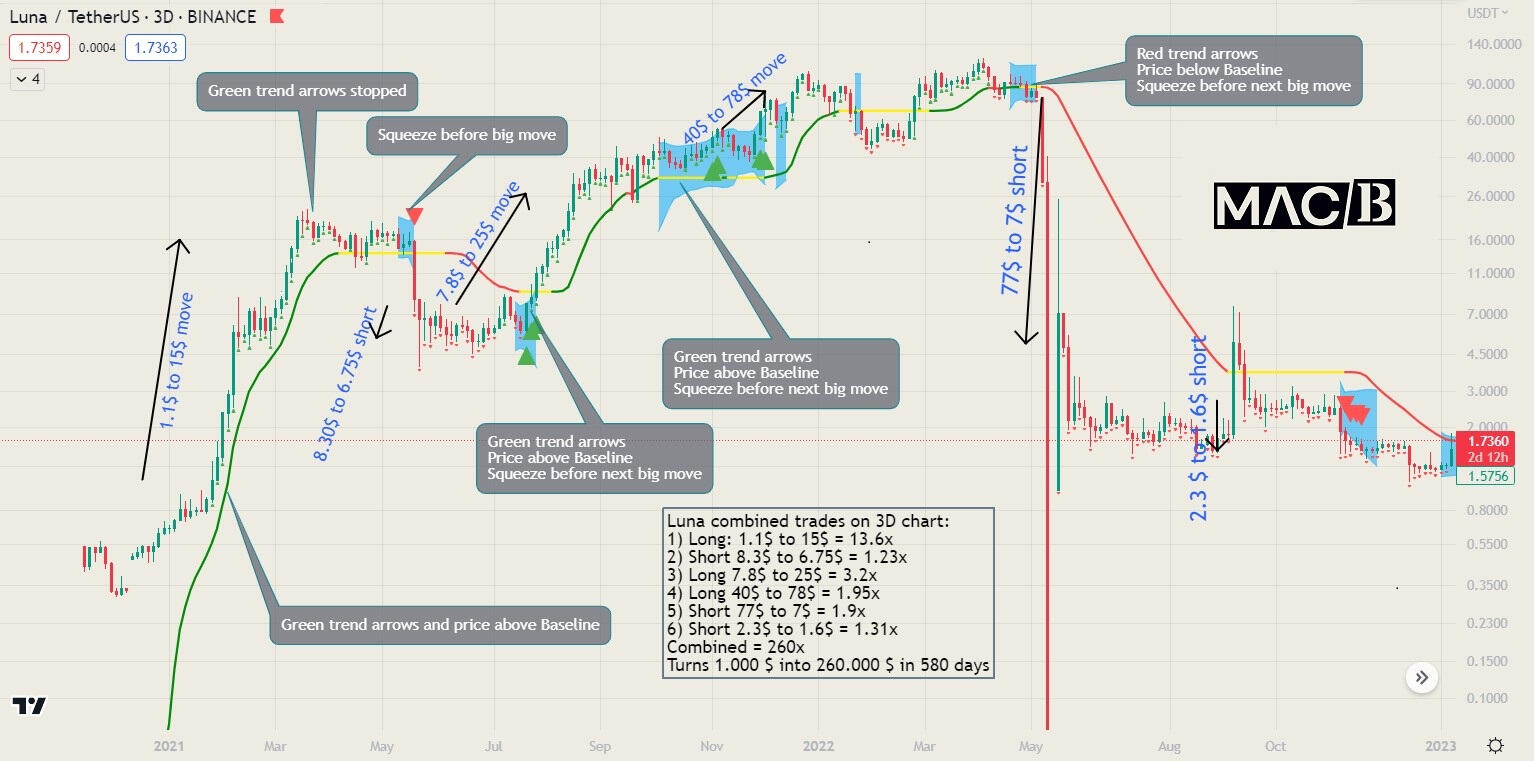
Luna 3D chart
Following simplest rules of...
longing price action above Baseline
shorting price action below Baseline
expecting strong moves after Squeeze Channels
...would give you enough information to actually benefit from Luna collapse, rather than getting rekt. Combined trades show possible 1000$ to 260.000$ in 580 days, doing just 6 trades!
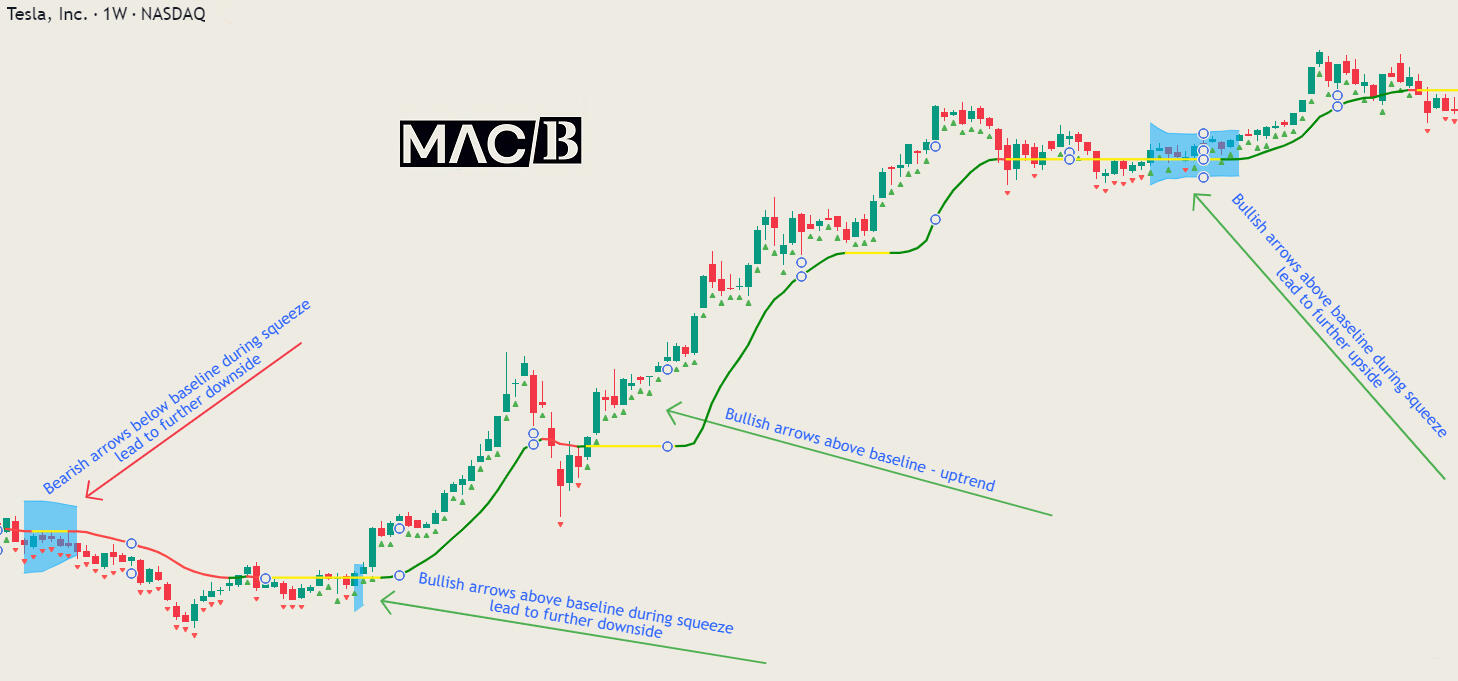
Tesla
TESLA/USD 1W chart
Tesla chart with MACB Indicator applied. All major moves can be anticipated with very simple analysis.
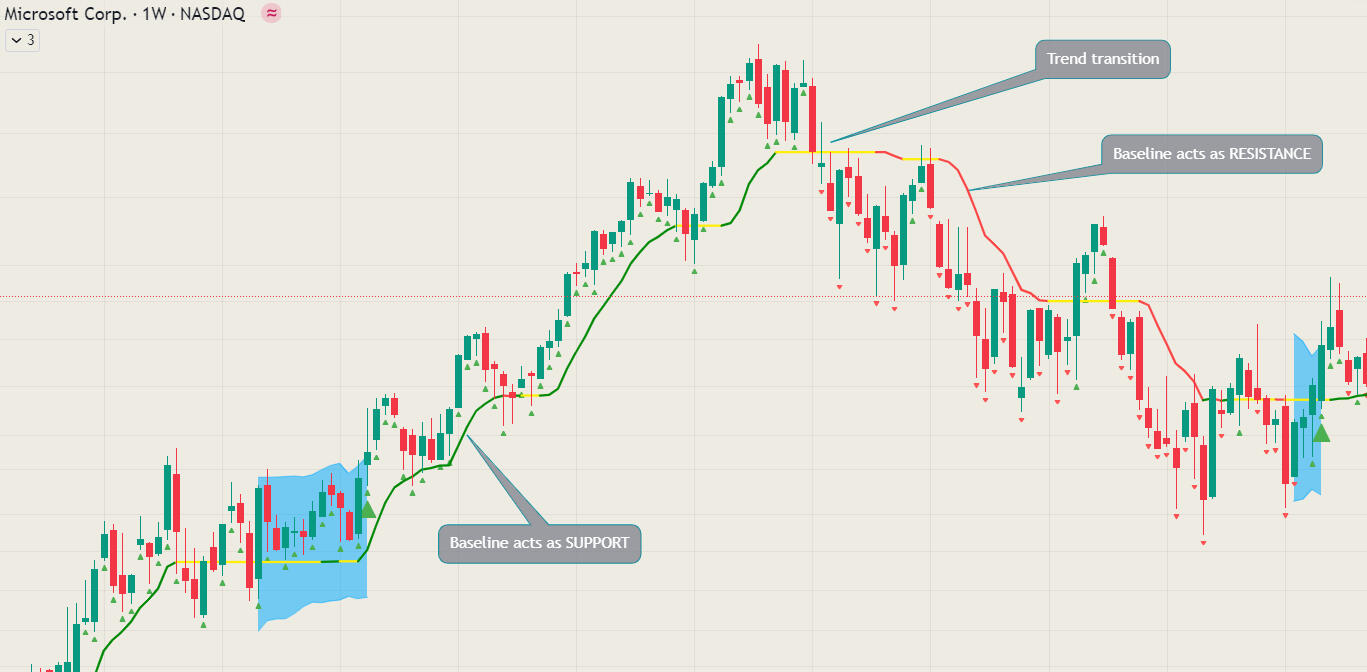
Microsoft
MSFT/USD 1W chart
Baseline acting as support in uptrend and resistance in the downtrend
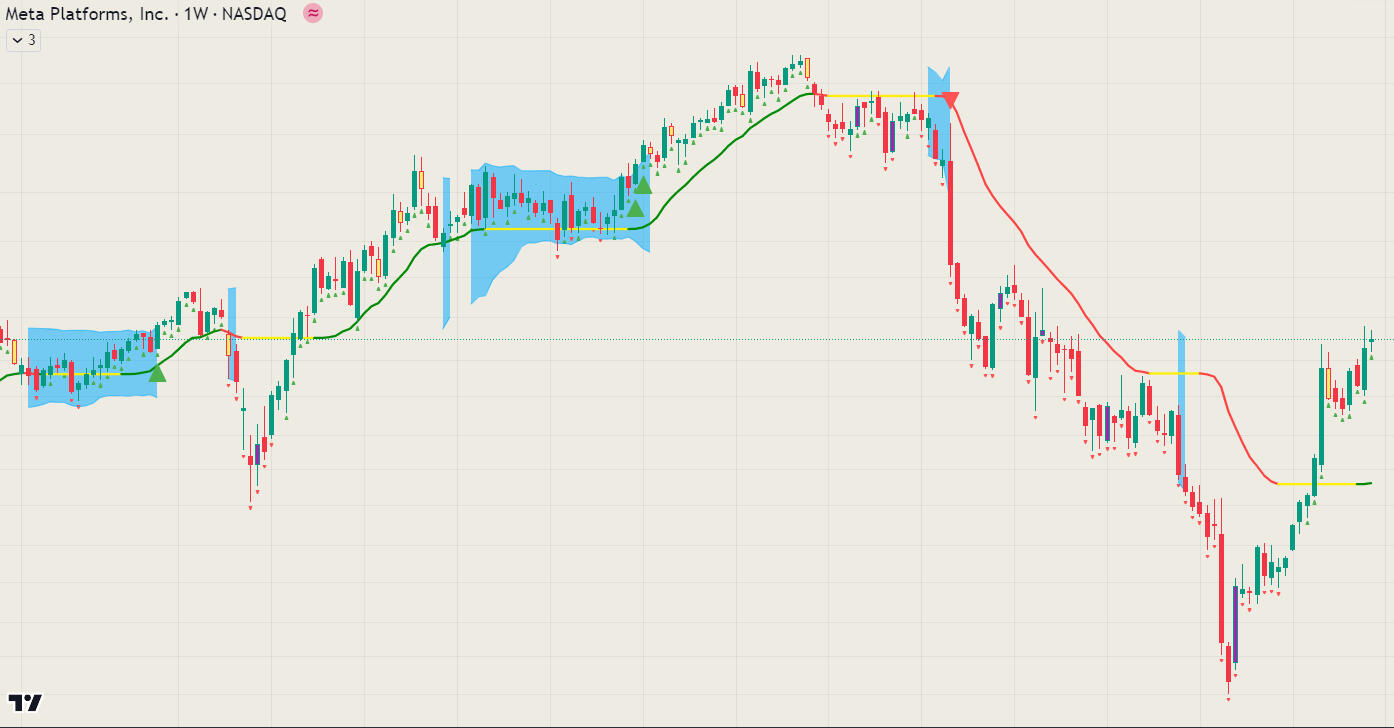
Meta
Meta/USD 1W chart
Baseline, Squeeze Breakouts, Micro Trend Arrows and Reversal Bars on 1 week chart of Meta/USD.
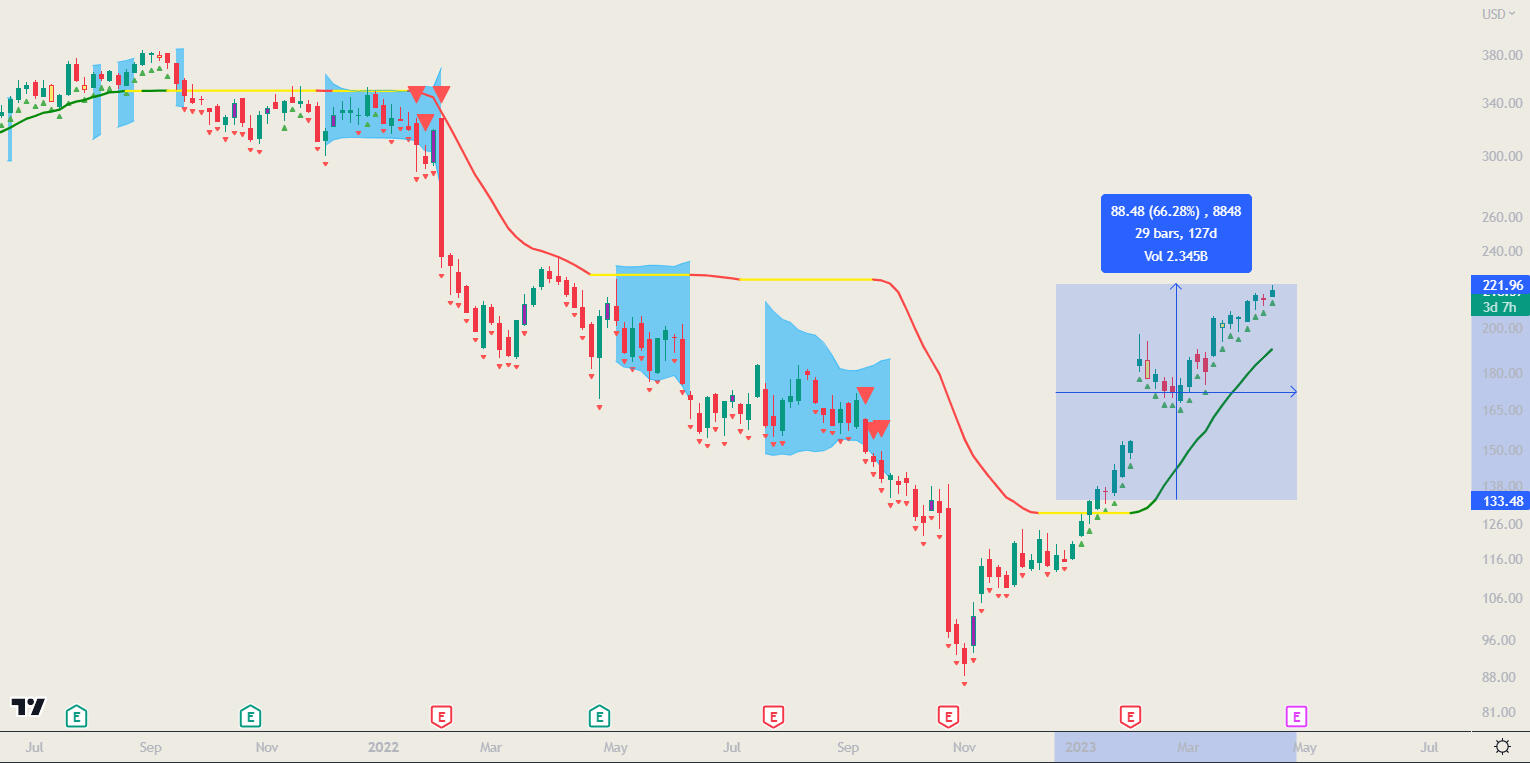
Meta
Meta/USD 3D chart
Following simple strategy of buying when green Trend Arrows start above Baseline - MACB could help you be in 66% profit
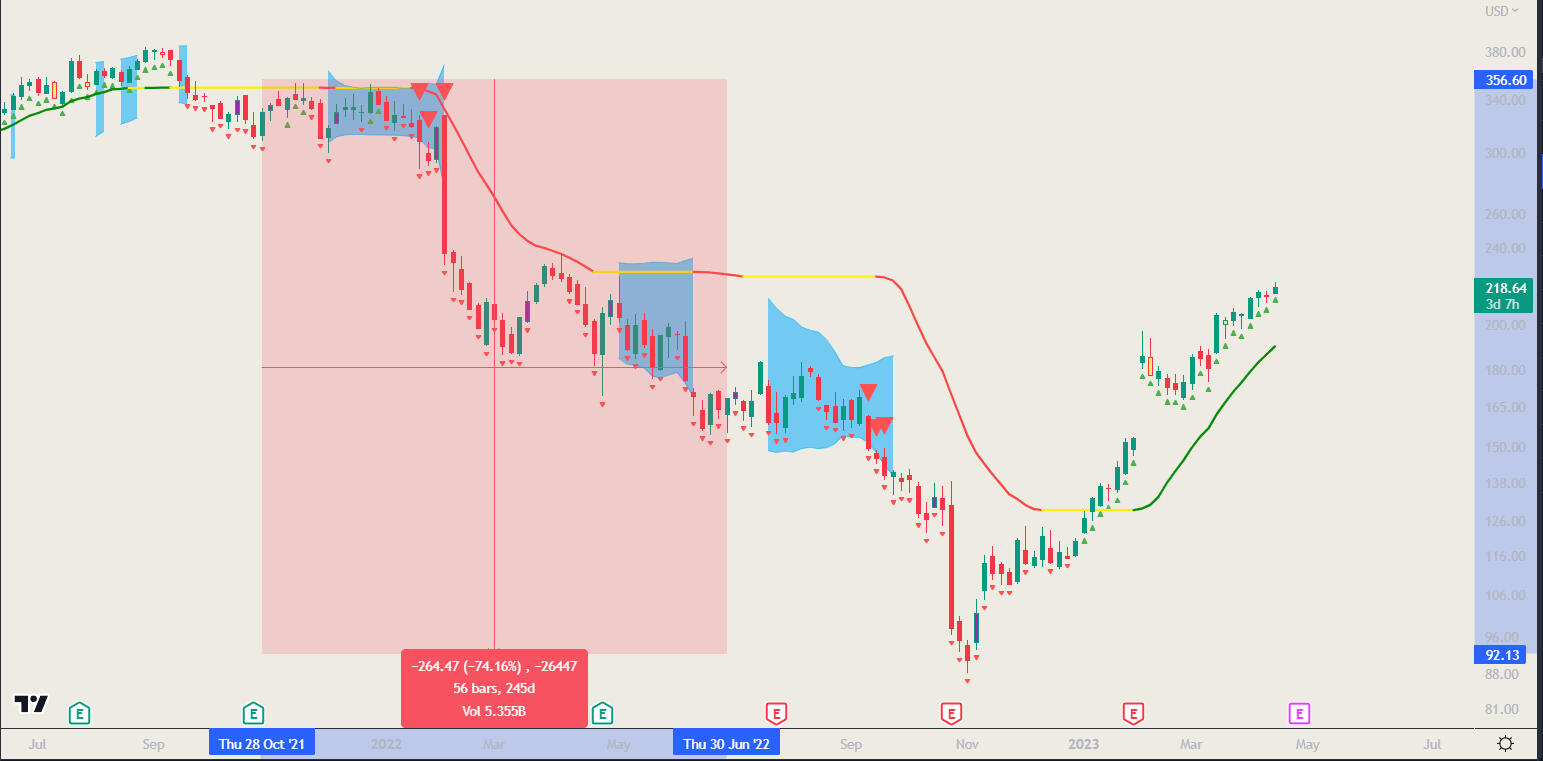
Meta
Meta/USD 3D chart
Following simple strategy of selling when green Trend Arrows stop - MACB could save you from 75% drop of META stocks, or give you huge shorting opportunities
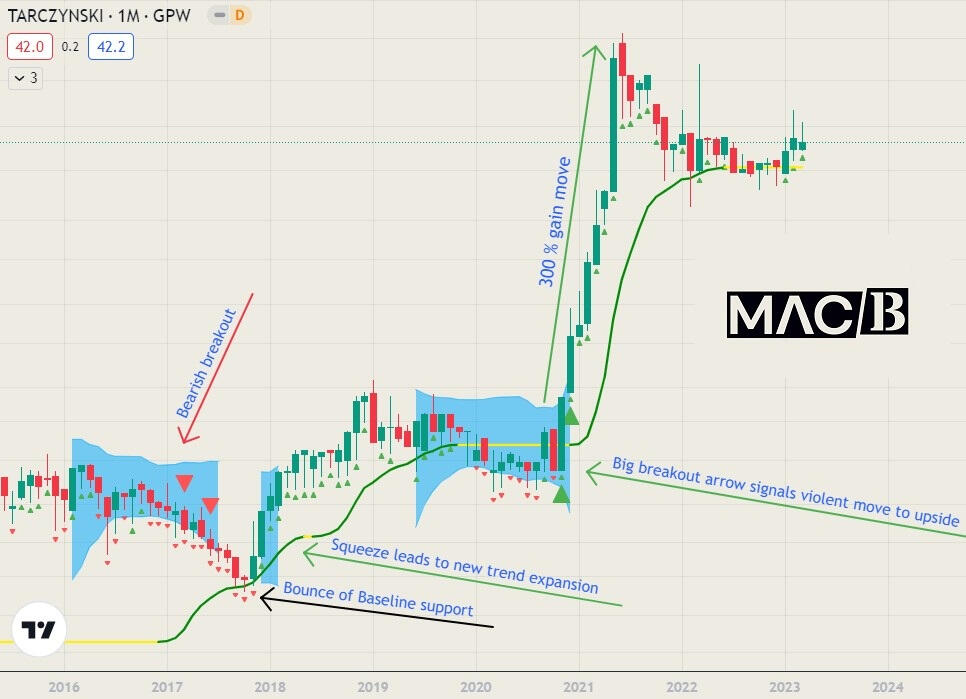
Tarczynski
TAR/PLN 1M chart
Polish GPW stocks of Tarczynski. MACB Indicator working across whole world markets.Shaded squeezes and trend arrows show direction on price movements. Breakout arrows right before next big move.
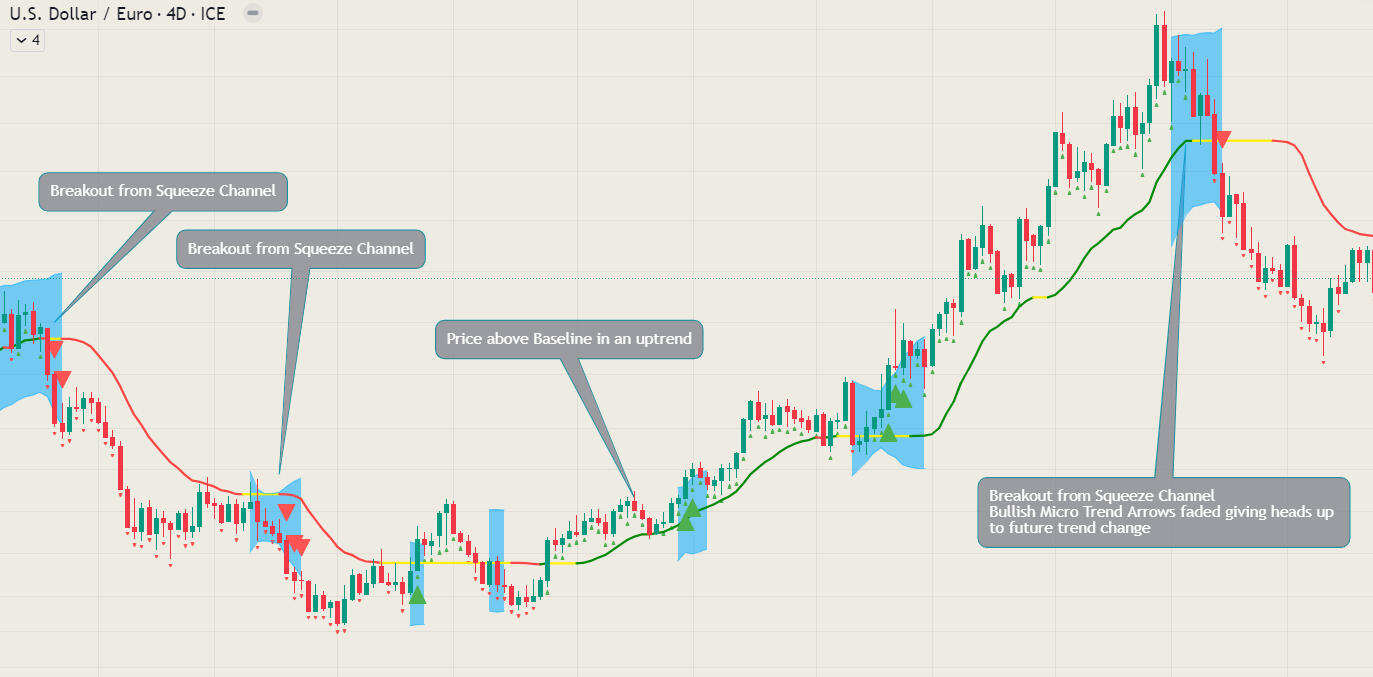
US Dollar EURO chart
USD/EUR 4D chart
Each major move is preceded with shaded Squeeze Channel. Baseline acts as resistance in a downtrend and as support in an uptrend. Micro Trend Arrows give you a heads up on possible trand change.
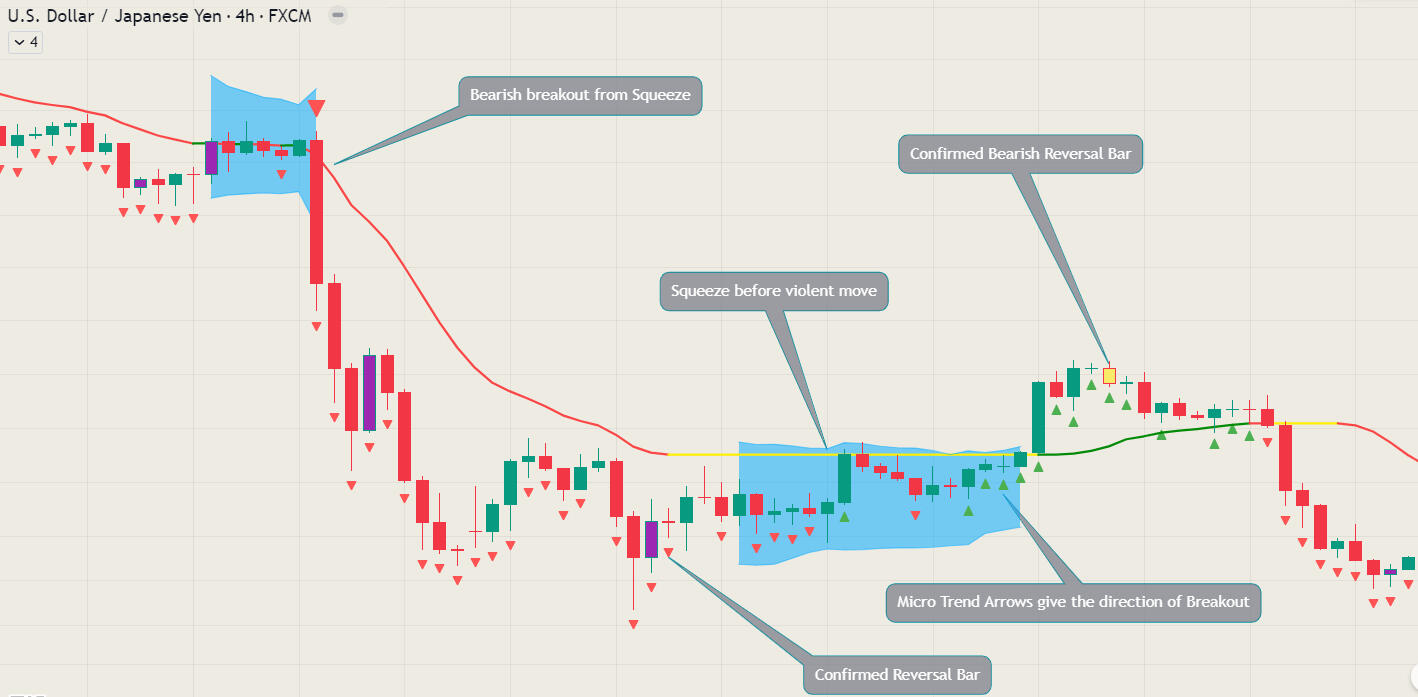
US Dollar Janapese Yen
USD / JPY 4H chart
Squeezes and Reversal Bars shown on a USD/JPY 4H chart - MACB Indicator can be used on every timeframe!
Note that Reversal Bars need a confirmation technique which I explain in Users Manual.
I am new to trading. Can I use this indicator?
Even a begginer trader can understand the principles behind MACB tools and make use of them! I strongly advise you to read Users Manual more than once!
I will link tutorial videos for better understanding.
Soon I will also launch trading course to help you learn even more.
Do I need Trading View account?
Yes, you need Trading View account to use MACB Indicator and MACB Strategies. You can open new account using my refferal link.
Do you give trading signals?
You will not need trading advice once you start using this MACB Indicator or MACB Strategy. However, I occasionaly share my insights on Twitter account.
I am an experienced trader - will I benefit from MACB Indicator or Strategy?
Even long time traders and investors can make MUCH bigger profits once they start using this indicator and strategy. MACB is self sufficient indicator, however you can use it for confluence with different trading strategies which suit your style. You can also use my own MACB Strategy with prooved record of huge historical gains.
I also give more info on different possible strategies in Users Manual. Check it out!
Thank you for your trust.
Please keep an eye on your inbox for further instructions! Typically you should be granted access to MACB in 24h.
Thank you for your trust.
Please keep an eye on your inbox for further instructions! Typically you should be granted access to MACB in 24h.
Thank you for your trust.
Please keep an eye on your inbox for further instructions! Typically you should be granted access to MACB in 24h.
Thank you for your trust.
Please keep an eye on your inbox for further instructions! Typically you should be granted access to MACB in 24h.
Thank you for your trust.
Please keep an eye on your inbox for further instructions! Typically you should be granted access to MACB in 24h.
Thank you for your trust.
Please keep an eye on your inbox for further instructions! Typically you should be granted access to MACB in 24h.